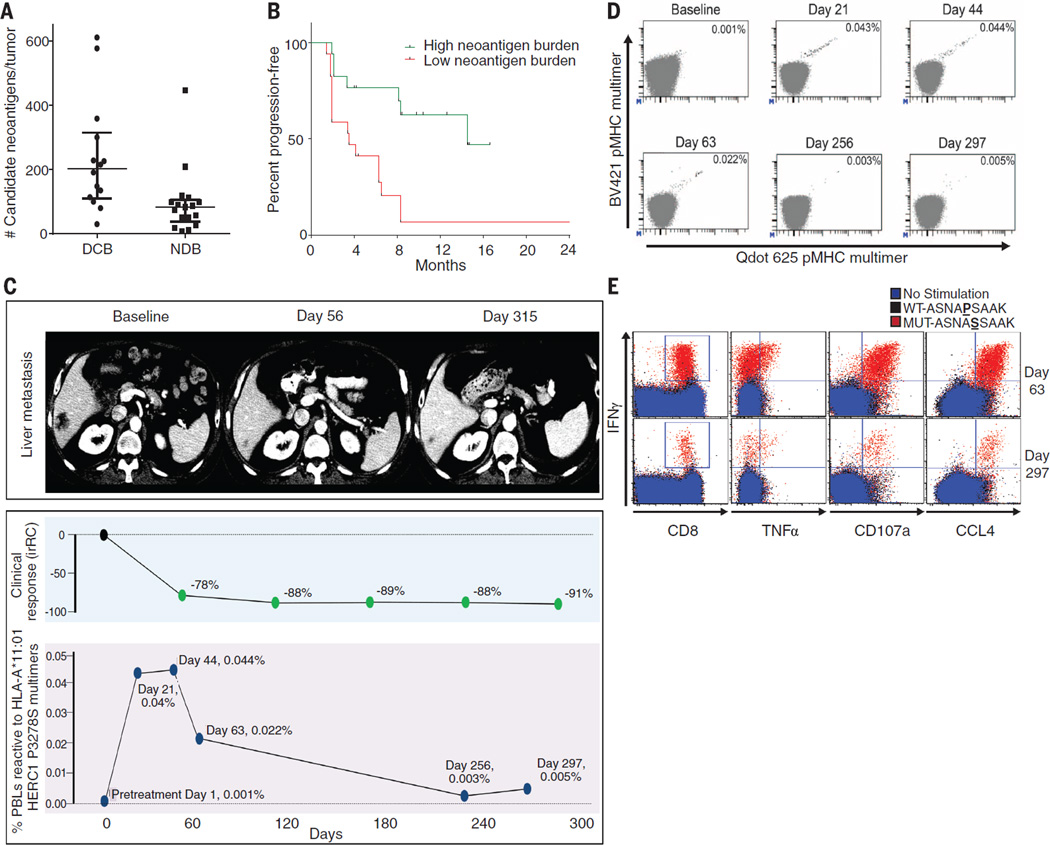
Fig. 4. Candidate neoantigens, neoantigen-specific T cell response, and response to pembrolizumab.
(A) Neoantigen burden in patients with DCB (n = 14) compared to NDB (n = 17) across the overall set of sequenced tumors (median 203 versus 83, Mann-Whitney P = 0.001). (B) PFS in tumors with higher candidate neoantigen burden (n = 17) compared to tumors with lower candidate neoantigen burden (n = 17) (HR 0.23, 95%CI 0.09 to 0.58, log-rank P = 0.002). (C) (Top) Representative computed tomography (CT) images of a liver metastasis before and after initiation of treatment. (Middle) Change in radiographic response. (Bottom) Magnitude of the HERC1 P3278S reactive CD8+ T cell response measured in peripheral blood. (D) The proportion of CD8+ T cell population in serially collected autologous PBLs recognizing the HERC1 P3278S neoantigen (ASNASSAAK) before and during pembrolizumab treatment. Each neoantigen is encoded by a unique combination of two fluorescently labeled peptide-MHC complexes (represented individually on each axis); neoantigen-specific T cells are represented by the events in the double positive position indicated with black dots. Percentages indicate the number of CD8+ MHC multimer+ cells out of total CD8 cells. (E) Autologous T cell response to wild-type HERC1 peptide (black), mutant HERC1 P3278S neoantigen (red), or no stimulation (blue), as detected by intracellular cytokine staining. T cell costains for IFNγ and CD8, TNFα, CD107a, and CCL4, respectively, are displayed for the Day 63 and Day 297 time points.

