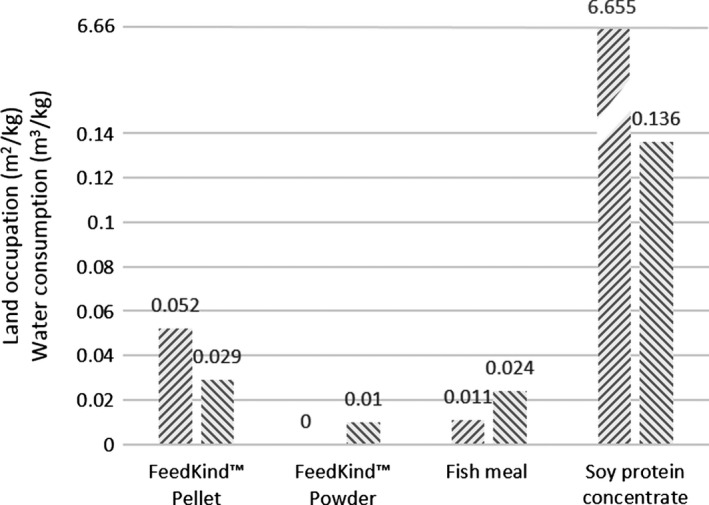
Figure 2.

Land ( ) and freshwater (
 ) requirements of MP compared with fishmeal and soy protein concentrate. The values are normalized to the protein content of each product. Source: Cumberlege et al. (2016)

Land ( ) and freshwater (
 ) requirements of MP compared with fishmeal and soy protein concentrate. The values are normalized to the protein content of each product. Source: Cumberlege et al. (2016)