
Figure 2.
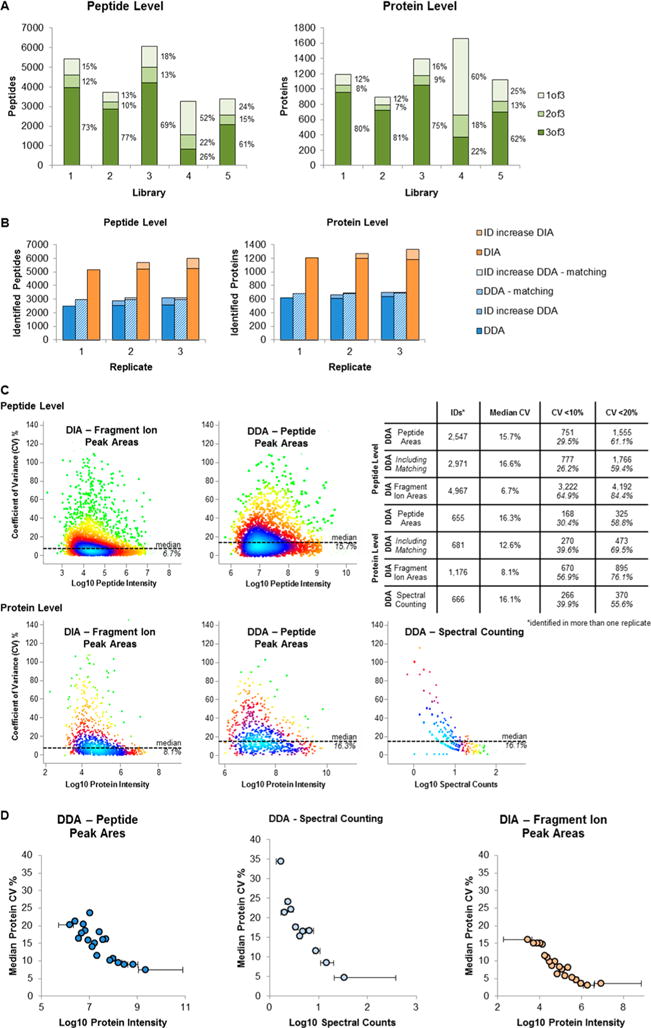
Validation of workflow. (A) Influence of spectral library. A urinary sample was analyzed in triplicate with a DIA method on a Q Exactive HF mass spectrometer using five different spectral libraries (overview in Table 1). Plotted are the total numbers of identified peptides and proteins; each bar is divided into peptides/proteins that were identified in three of three replicates (dark green), two of three (green), and one of three (light green) as well as the percentages. (B) Number of peptide and protein identifications in replicate runs. A urinary sample was analyzed three times by a DDA and DIA methods on a Q Exactive mass spectrometer and analyzed using the comprehensive urinary library (library 3). The DDA data were analyzed in MaxQuant with and without the ID matching. We plotted the number of identified peptides and proteins (DIA, orange; DDA without matching, blue; DDA with matching, blue/white stripes) as well as the increase in identifications with each of the replicates (DIA, light orange; DDA, light blue). (C) Quantification precision. An independent urine sample was analyzed in triplicate with a DDA and DIA method on a Q Exactive HF mass spectrometer. DDA were quantified in MaxQuant either based on peptide peak areas (DDA, peptide peak areas) or spectral counting (DDA, spectral counting). DIA data were quantified in Spectronaut (DIA, fragment ion peak areas). For both peak area based quantification methods, protein values were calculated by summation of the peptide peak areas. The %CV of the quantification was calculated, plotted against the peptide/protein intensity, and the point density was color coded (Perseus: light blue, highest density; green, lowest density). The table gives an overview of the quantified peptides/proteins as well of number of peptides/proteins with a %CV below 10% and 20%. (D) Protein %CV in relation to protein abundance. The quantified proteins have been binned according to their intensity into 20 bins. The median %CV of each bin was plotted for three quantification methods (right panel, based on peptide peak areas of DDA data; middle panel, spectral counting; left panel, based on fragment peak areas of DIA data). The horizontal bars show the protein intensity spread of each bin.