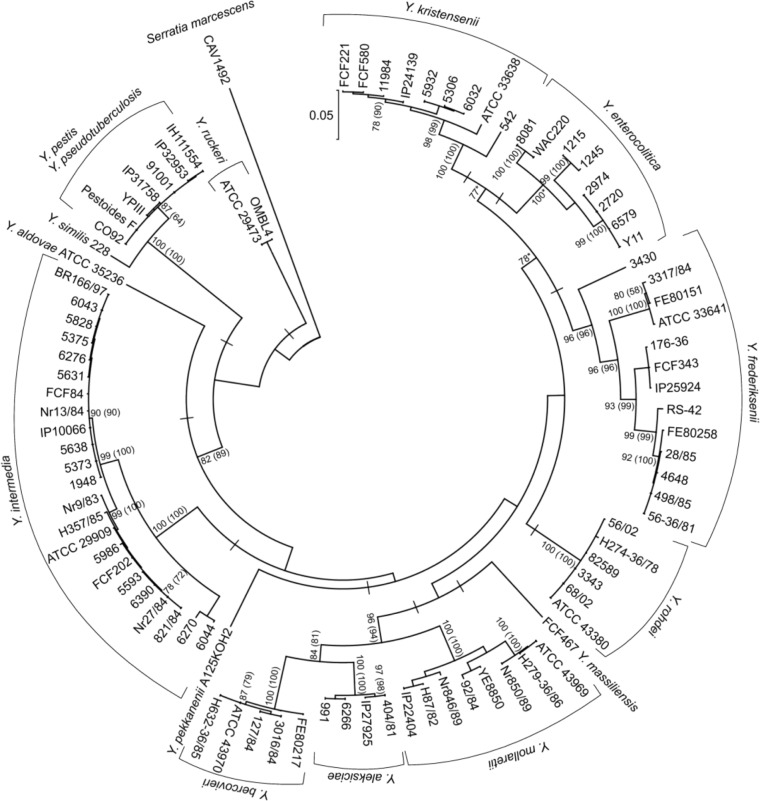
Figure 1.
Maximum likelihood tree of Yersinia ompC. The scale displays the number of nucleotide substitutions per nucleotide site. Numbers at nodes of the tree – the bootstrap value in percentage (75% cutoff). Bootstrap values obtained for the neighbor-joining method are in parentheses.
Note: *Difference in the tree topology when compared with the neighbor-joining one. S. marcescens CAV1492 – out-group.

