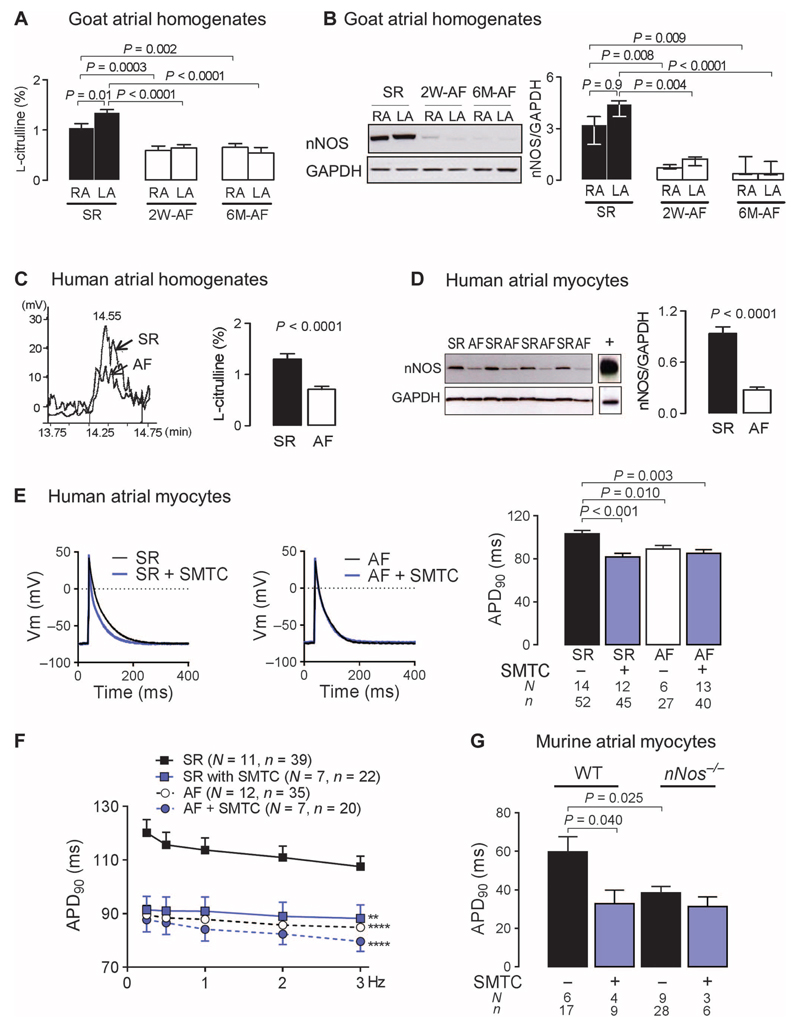
Fig. 1. Loss of atrial nNOS in AF contributes to atrial electrical remodeling.
(A) Atrial NOS activity (percent conversion of L-arginine to L-citrulline, reflecting NO synthesis) in right atrial (RA) and left atrial (LA) tissues from goats at 2 weeks (2W) or 6 months (6M) of AF (n = 6 to 8) or SR (n = 9 to 11). Data are averages ± SEM. P values were determined by one-way analysis of variance (ANOVA) with Bonferroni correction. (B) nNOS immunoblots in goat atrial tissue at 2 weeks or 6 months of AF (n = 6 to 8) or SR (n = 9 to 11). Data are medians and interquartile ranges. P values were determined by Kruskal-Wallis test. GAPDH, glyceraldehyde-3-phosphate dehydrogenase. (C) Representative chromatograms of L-citrulline production (left) and average atrial NOS activity ± SEM (right) in RA samples from patients in SR (n = 17) or AF (n = 19). P value was determined by unpaired t test. (D) nNOS protein content in human RA myocytes from patients in SR (n = 19) or AF (n = 12). Murine brain was used as positive control for nNOS (lane marked with +). Data are averages ± SEM. P value was determined by unpaired t test. (E) Effect of nNOS inhibition with SMTC on APD90 in RA myocytes from patients in SR or AF. Representative action potential traces (left panel) and average APD90 ± SEM (right panel). P values were determined by one-way ANOVA with Bonferroni correction. Vm, membrane potential. (F) Frequency-dependent change in APD90 in RA myocytes from patients in SR or AF in the presence or absence of SMTC. Data are averages ± SEM. **P < 0.01, ****P < 0.0001 versus SR; P = 0.0003 for the interaction between groups and stimulation frequency (not shown), by two-way ANOVA with Bonferroni correction. (G) The effect of nNOS inhibition or gene deletion on APD90 in murine RA myocytes. Data are averages ± SEM. P values were determined by one-way ANOVA with Bonferroni correction. In (E) to (G), N is the number of animals, whereas n is the number of cells. WT, wild type.

