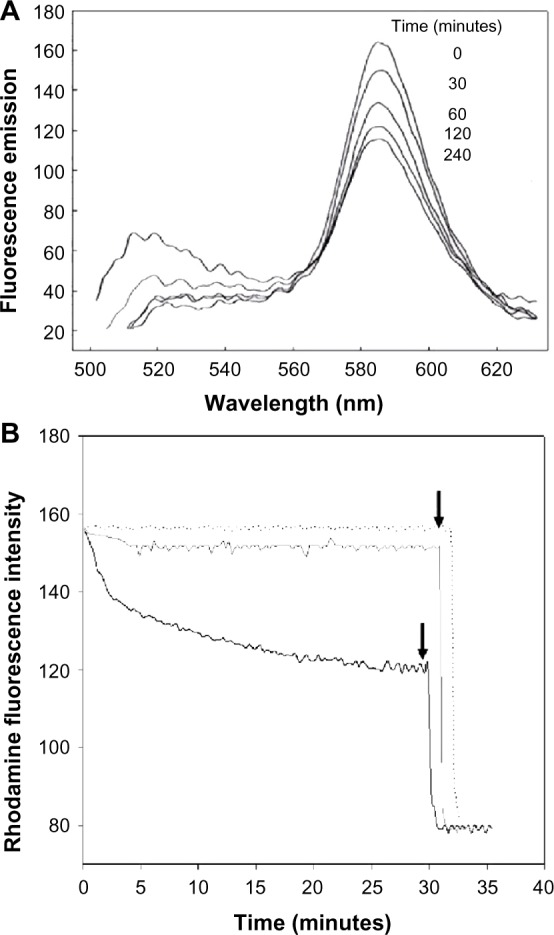
Figure 1.

Fusion of fluid liposomes with Pseudomonas aeruginosa 29248 monitored by lipid mixing assay.
Notes: (A) Fluorescence emission scans of a mixture of labeled liposomes and intact bacteria in a wavelength range of 510–630 nm. Fusion of liposomes with bacteria resulted in NBD fluorescence increase (520 nm) and Rh fluorescence decrease (590 nm) under steady state excitation at 475 nm with a slit width of 7 nm. (B) Time drive of Rh fluorescence intensity (590 nm) when liposomes were mixed with intact bacteria. Black line represents a rapid accelerating phase in the first 5 minutes followed by a slower phase. Dotted line represents a control experiment of labeled liposomes with non-labeled liposomes at a ratio of 1:10. Gray line represents Rh fluorescence decrease when DPPC/DMPG/Chol (8:1:1) are mixed with intact bacteria under the same conditions as described. Arrows indicate addition of triton X-100 to a final concentration of 0.1%.
Abbreviations: Chol, cholesterol; DMPG, dimyristoyl phosphatidylglycerol; DPPC, dipalmitoyl phosphatidylcholine; NBD-PE, 1,2-dioleoyl-sn-glycero-3phosphoethanolamine-N-(7-nitro-2-1,3-benzoadiazol-4-yl); Rh-PE, 1,2-dioleoyl-sn-glycero-3-phosphoethanolamine-N-(lissamine Rhodamine B sulfonyl).
