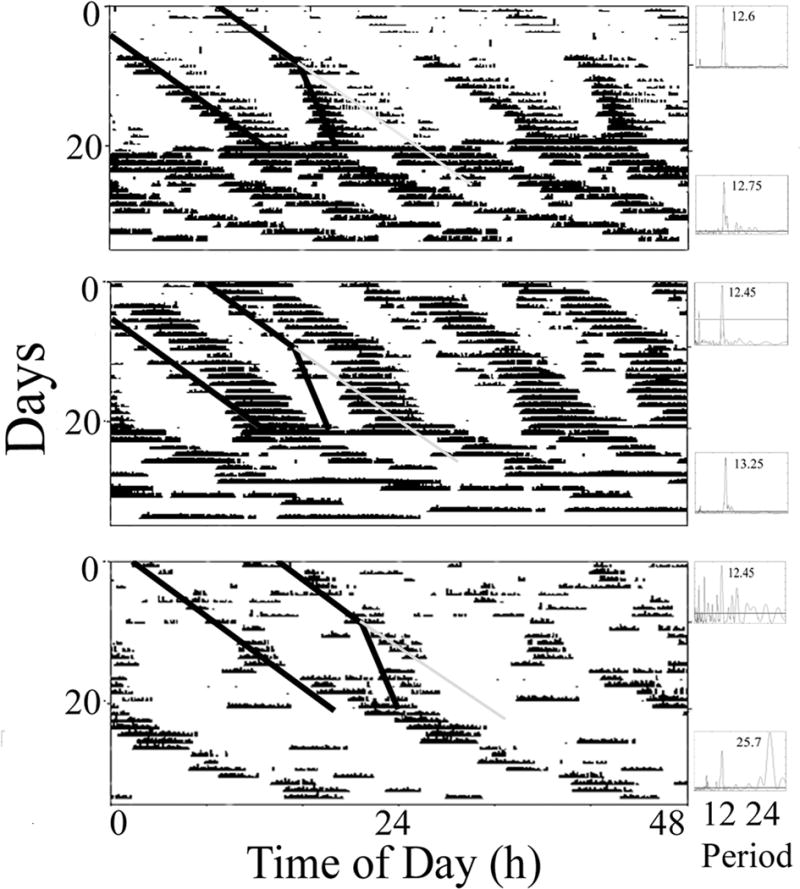
Figure 2.

The effects of circalunidian tidal cues on the activity of three representative horseshoe crabs in LL. Large panels (actograms): During the first 10 days crabs were exposed to two identical artificial tides with periods of 24.8 hr. During the second 10 days they were exposed to artificial tides with two different periods (24.8 and 24.4 hr). Then, during the last 13 days, they were in water of a constant depth. Small panels: Lomb-Scargle periodogram analyses of the first and last 10 days of each actogram. Highest significant (P<.001; horizontal lines) peaks in the circatidal (10.4–14.4 hr) or circalunidian (22.8–26.8 hr) range are noted. Note that two crabs (top, middle panels) appear to synchronize to the tides during both phases Bottom panel – an individual that does not synchronize as clearly and displays a primarily unimodal free-running rhythm (~25.7 hr) with some indication of a second, weaker bout.
