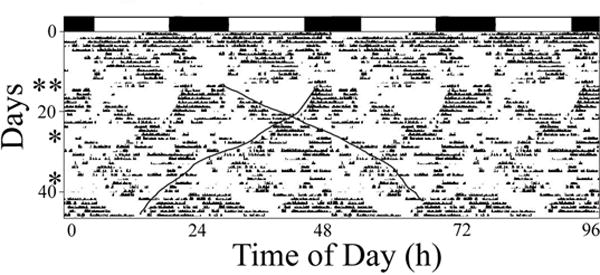
Figure 4.

Quadruple-plotted actograms illustrating spontaneous changes in period in crabs exposed to flow-through estuarine water, natural photoperiods, and constant water levels. Approximate photoperiods are indicated at the top of each panel. * - crab were handled (accelerometers downloaded); ** crabs were handled and small blood samples were taken for another study. Dark lines - hand drawn lines indicating the apparent onset or end of activity and indicating two separate bouts of activity that “free-run” at different periods, one shorter than 24h and one longer than 24h).
