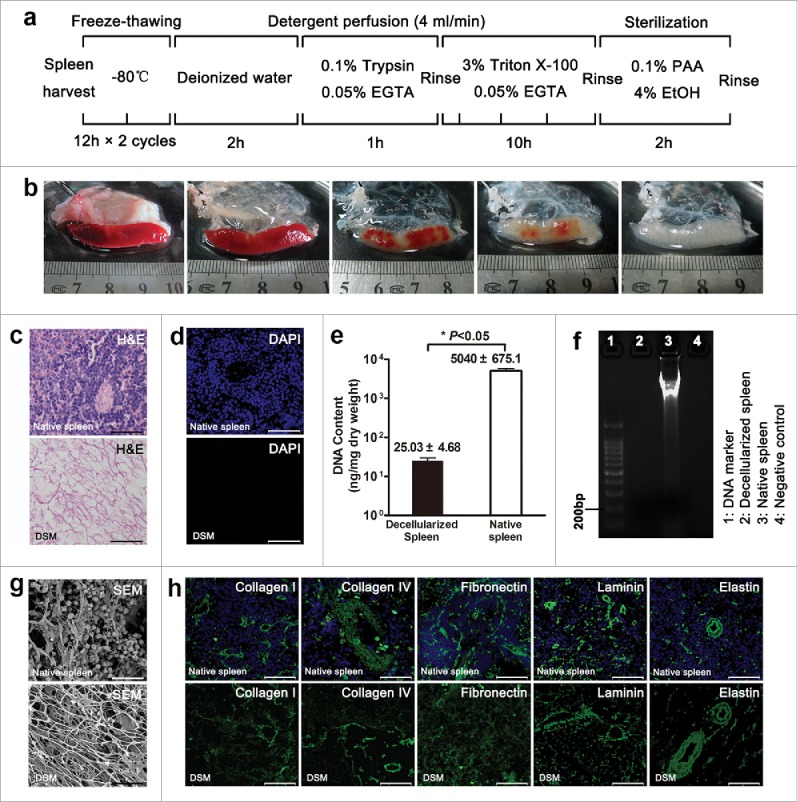
FIGURE 1.

Decellularization and characterization of rat decellularized spleen. (a) Schematic representation of the sequential whole-spleen decellularization protocol. (b) General appearance of rat spleen at various steps in the decellularization process. H-E (c), DAPI (d) staining and remnant DNA analysis (e, f) confirmed the degradation of cell contents. (g) SEM images showing the absence of cellular material but preservation of 3-dimensional porous architecture. (h) Immunofluorescent staining with similar ECM components of DSM as native spleen. Scale bars: 50 μm (c), (d), (h), 20 μm (g).
