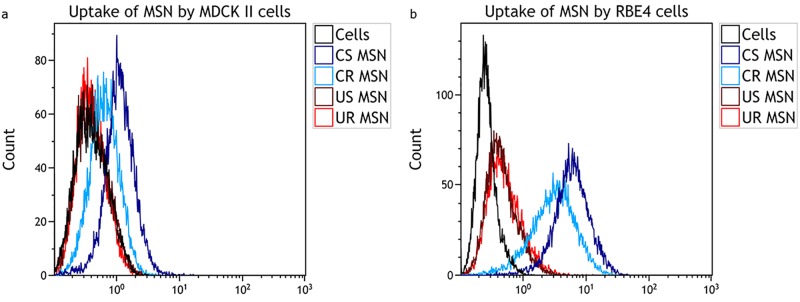
Fig 5. Flow cytometry histograms for determining the uptake of different MSNs that were incubated with the MDCK II and RBE4 cells at a concentration of 20 μg/ml for 24 hours in serum-free medium.
Negative control–cells not incubated with the MSNs. a) Representative histograms showing uptake of MSNs in MDCK II cells. b) Representative histograms showing uptake in RBE4 cells.

