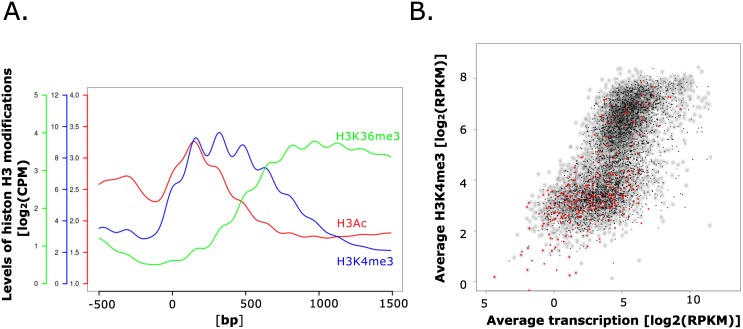
Fig 3. H3K4me3 localizes to actively transcribed genes.
A. The metaplot depicts the enrichment pattern of H3K4 trimethylation (H3K4me3), H3K36 trimethylation (H3K36me3), and H3K9/K14 acetylation (H3Ac) for all genes on chromosome 4 in wild type actively growing cells (17h cultures). All genes are aligned to the predicted ATG (position 0) and analysed for a 2 kb window starting with 500 bp of their 5´UTR and promoter sequences (-500) followed by 1500 bp of their coding region (indicated positions within coding region 500, 1000 and 1500 bp). Counts were binned in 10-bp windows and averaged. B. The scatter plots shows the relationship between the average expression level and H3K4me3 enrichment. Values on the x-axis represent the average expression level of each gene determined by RNA-seq from both 17 and 48h cultures (see methods; log2 RPKM). On the y axis, normalized and H3K4me3 levels averaged over the whole gene (log2 RPKM) are shown for each of these genes. Grey dots represent constitutively expressed genes), and genes differentially expressed in the two tested conditions (with a p-value of p ≤0.001) are represented as black or red dots where the latter indicate differentially expressed genes involved in SM biosynthesis.

