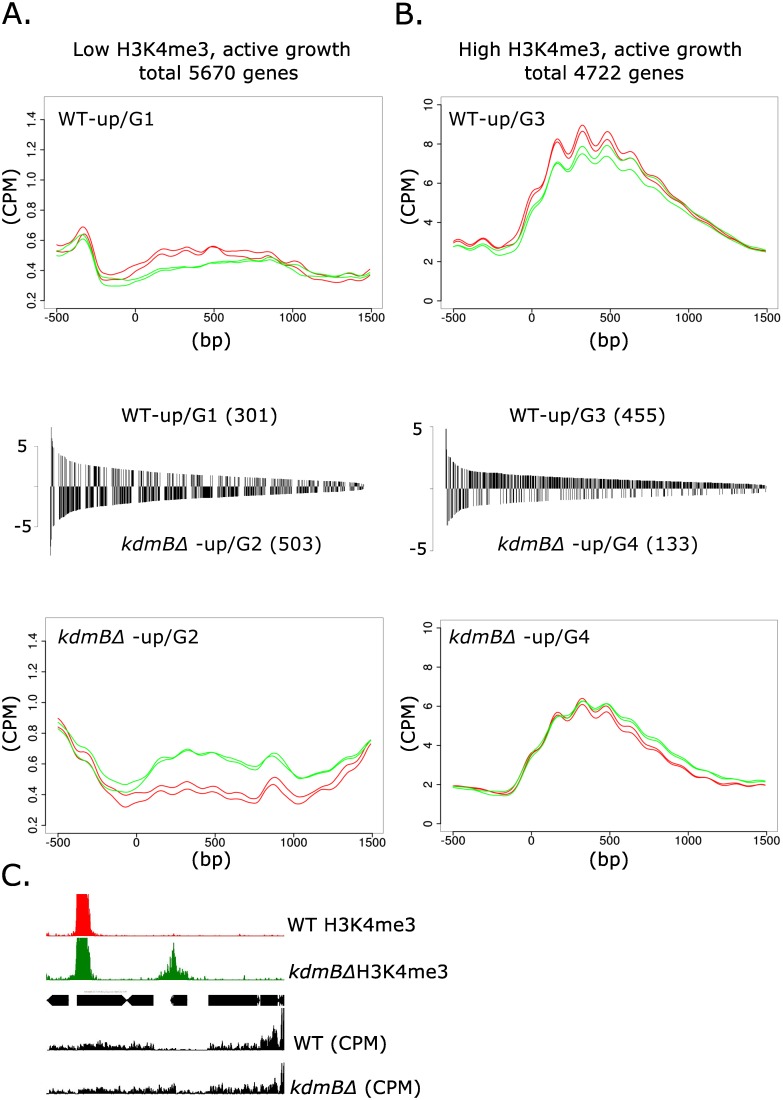
Fig 5. KdmB influences transcriptional activity and H3K4me3 levels.
The Figure shows global correlation analysis of H3K4me3 levels and KdmB-dependent transcription in nutrient-rich culture cells (primary metabolism). All genes were categorized according to two criteria, i.e. at least 4-fold differential expression in WT and kdmBΔ as well as the degree of H3K4 trimethylation. This resulted in four categories, low (log2 RPKM ≤ 5, panel A) and high (log2 RPKM > 5, panel B) H3K4me3 levels and transcriptional up-/or downregulation in the kdmB mutant. For each open reading frame in these categories, the coverage in CPM (counts per million of reads) was calculated within a 2kb window around the predicted ATG (-500 to +1500) and represents the average enrichment level of this mark. Details on the bioinformatic procedure used to determine CPM values over all points in all genes are given in Materials and Methods. Red lines in the meta-plots indicate CPM values for the WT, while green lines indicate values obtained for kdmBΔ. The number of individual genes in each category and their level of de-regulation are shown in the bar-graph between the meta-plots. Each bar in the graph represents the differential expression value of an individual gene in this group. With this procedure four different correlation groups (G1 –G4) emerged, i.e. genes with low and high H3K4m3 levels requiring KdmB for normal transcription (WT-up/G1 and WT-up/G3, respectively) are expressed stronger in the wild type. Genes with low and high H3K4m3 levels under negative KdmB influence (kdmBΔ-up/G2 and kdmBΔ-up/G4, respectively) are stronger expressed in the kdmBΔ mutant. For all values, p<0.005 was set as threshold. C. Genome viewer image of one representative gene (locus AN6321) within the low H3K4me3 category in which kdmB deletion leads to gain of H3K4me3 (green boxed area) and higher transcription (kdmBΔ-up/G2 gene).

