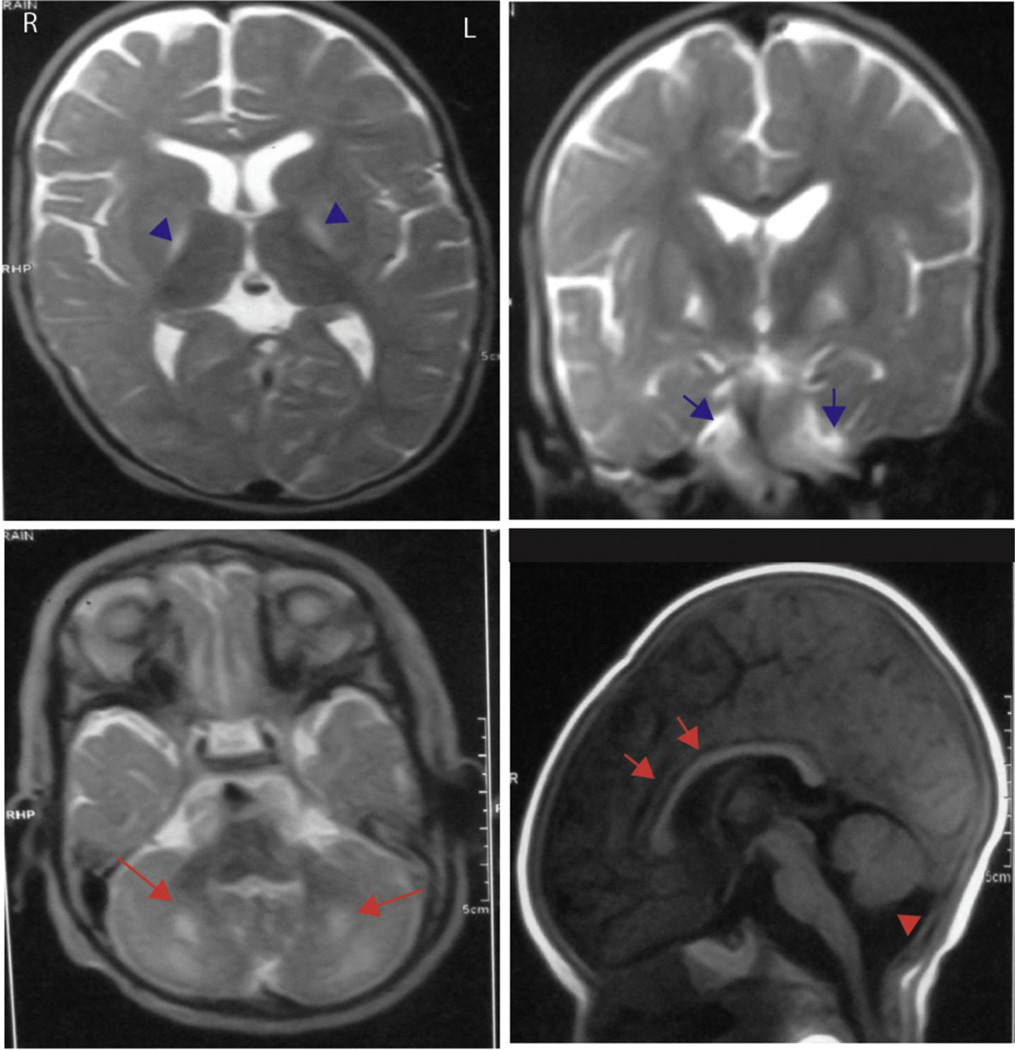
Fig. 3.
MRI brain for patient 6 with MOCD2 mutation. Note high signal of basal ganglia (blue arrowheads), high intensity of the white matter of cerebellum (blue arrows and bigger red arrows), thin corpus callosum (red arrows) and cerebellar atrophy (red arrowhead). (For interpretation of the references to color in this figure legend, the reader is referred to the web version of this article.)

