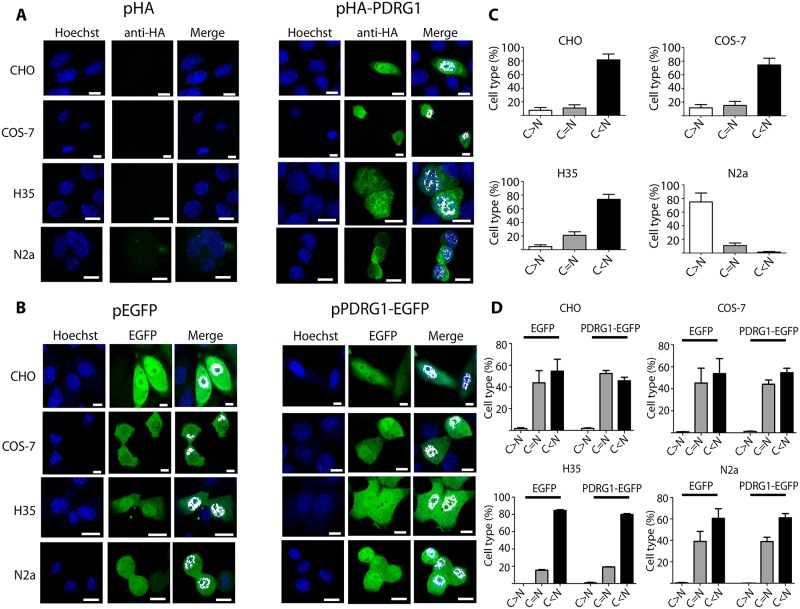
Fig 3. Subcellular localization of PDRG1 in mammalian cell lines.
(A) Representative confocal immunofluorescence images of HA-PDRG1 localization using mouse anti-HA and anti-mouse Alexa Fluor 488; a minimum of three independent experiments were carried out in cuadruplicate. CHO (Chinese hamster ovary), COS-7 (monkey kidney), H35 (rat hepatoma) and N2a (mouse neuroblastoma) cells were transiently transfected with pHA, pHA-PDRG1, pEGFP or pPDRG1-EGFP. (B) Representative results of direct fluorescence localization using confocal microscopy of EGFP and PDRG1-EGFP; three independent experiments were performed in duplicate. Both panels show colocalization with Hoechst nuclear staining in white. (C) Histograms (mean ± SEM) show quantification results of nuclear (N) and cytoplasmic (C) fluorescence signals of a minimum of 200 cells per condition, using the Leica confocal software. Results of the C/N signal ratio calculated from immunofluorescence experiments are depicted. (D) Data of the C/N signal ratio from direct fluorescence observations. Cells were classified as: C>N with a ratio above 1.2; C = N when the ratio was 1 ± 0.2; and C<N with ratios below 0.8. Statistical evaluation was done by means of one-way ANOVA with Bonferroni post-hoc (*p<0.05 vs C = N). Scale bar = 10 μm.

