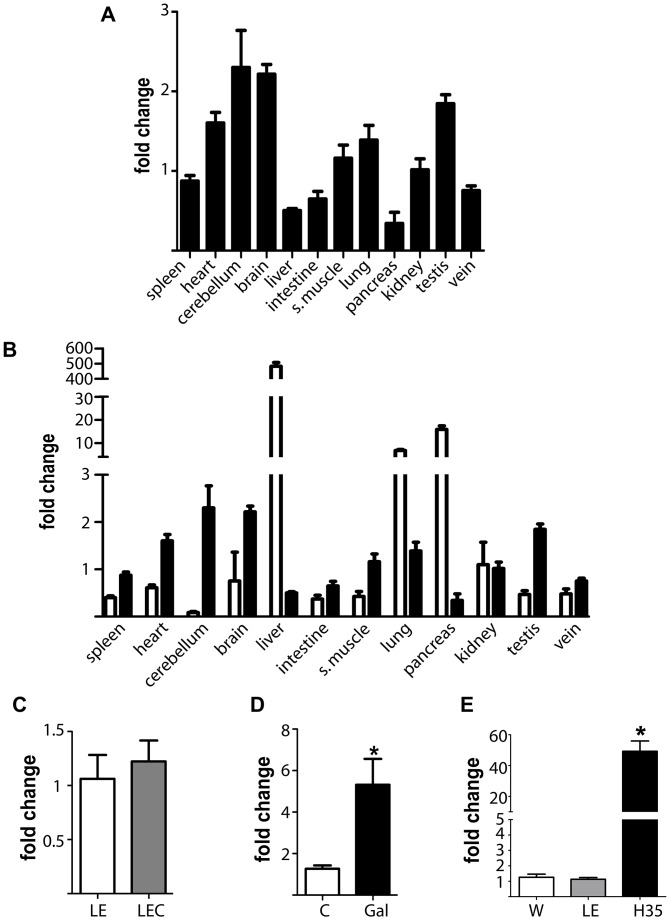
Fig 6. Pdrg1 expression evaluated by real-time RT-PCR in rat tissues and models of hepatic disease.
(A) Pdrg1 expression levels in several rat tissues (N = 3), using kidney levels as reference for graphical purposes. (B) Comparison of Mat1a (white) and Pdrg1 (black) expression levels using kidney levels as reference for graphical purposes. (C) Changes in Pdrg1 hepatic expression at early stages of Wilson’s disease using Long Evans Cinnamon rats 9-weeks old (LEC, N = 6) and matched control Long Evans rats (LE, N = 5). (D) Changes in Pdrg1 hepatic expression upon D-galactosamine intoxication for 48 h (control group N = 13, galactosamine group N = 11). (E) Pdrg1 expression differences between rat hepatoma H35 cells (N = 12) and normal livers of Wistar (W; N = 13) and LE (N = 5) rats. Histograms show the mean ± SEM of the fold change calculated against the control group using 18s data as reference. Statistical evaluation of the change in the animal models was performed by Students t-test against the appropriate control group (*p≤0.05).

