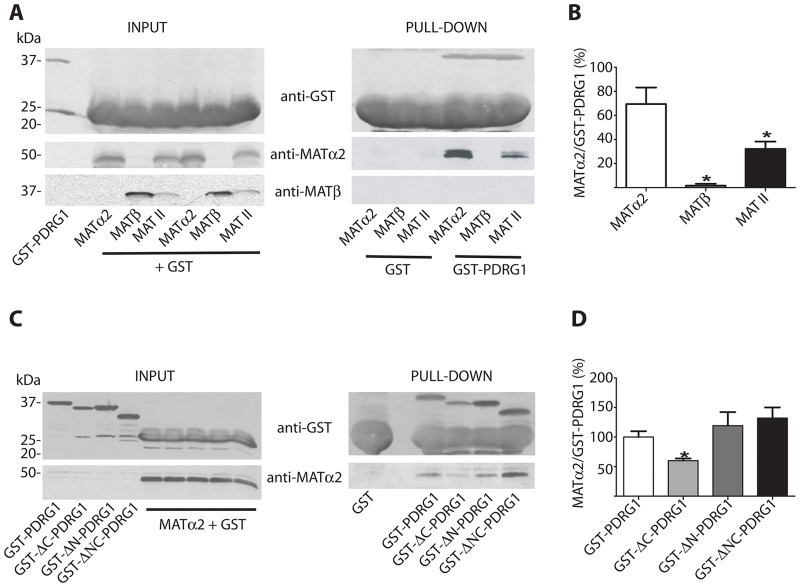
Fig 7. Pull-down analysis of PDRG1 interaction with MATα2 and MAT II.
(A) Representative western blots of pull-down experiments using glutathione Sepharose beads loaded with GST or GST-PDRG1 and recombinant MATα2, MATβ or the hetero-oligomer MAT II; anti-GST, anti-MATα2 and MATβ were used for detection. The size of the standards is indicated on the left side of the panels. (B) Quantification of the MATα2/GST-PDRG1 signal ratio (mean ± SEM) from five independent pull-down experiments. (C) Representative western blots of pull-down experiments carried out with the truncated PDRG1 forms and recombinant MATα2 using anti-GST and anti-MATα2. The size of the standards is indicated on the left side of the panels. (D) Quantification of the MATα2/GST-PDRG1 signal ratio (mean ± SEM) from five independent pull-down experiments. All the incubations with MAT subunits or MAT II were carried out in the presence of excess GST to avoid unspecific binding. (*p≤0.05 vs GST-PDRG1).

