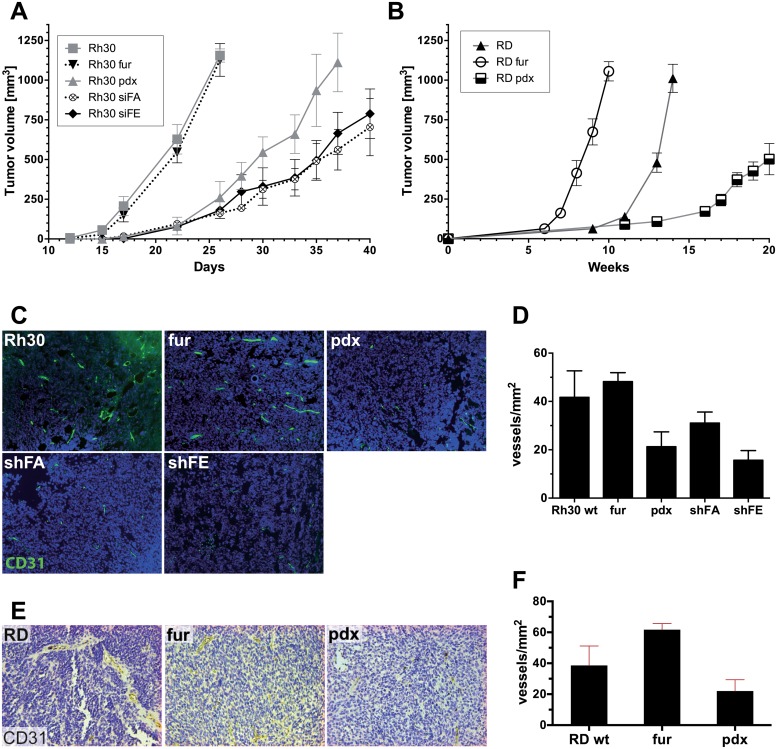
Fig 3. Furin activity positively correlates with tumor growth and microvessel density.
5 million RMS cells with stable modulation of furin activity were injected s.c. into NOD/Scid IL2reg-/- and tumor growth was monitored over time. A) Tumor growth in aRMS Rh30 xenografts. Tumors took on average 20–35 days to reach a size of 500 mm3. Each group consisted of 6 mice. B) Tumor growth in eRMS RD xenografts. Tumors took on average 7–19 weeks to reach a size of 500 mm3. Each group consisted of 10 mice. C) Histological analysis of microvessel density in Rh30 xenografts. Tumors were collected when they reached a size of 200–400 mm3 and sections were stained for CD31 by immunofluorescence. Blue: Nuclear DAPI staining. Representative pictures are shown (magnification: 10x). D) Microvessel density in Rh30 tumors was assessed as vessels per mm2. The graph shows the quantification averaged per picture. Depicted are mean values ± SD. E) Histological analysis of microvessel density of RD tumors. Tumors were collected at the end point and paraffin section were stained for furin and with H&E. Shown are representative pictures (magnification: 10x). F) Microvessel density in RD tumors was assessed as vessels per mm2. Three pictures per section, total one section. The graph shows the quantification averaged per picture. Depicted are mean values ± SD.

