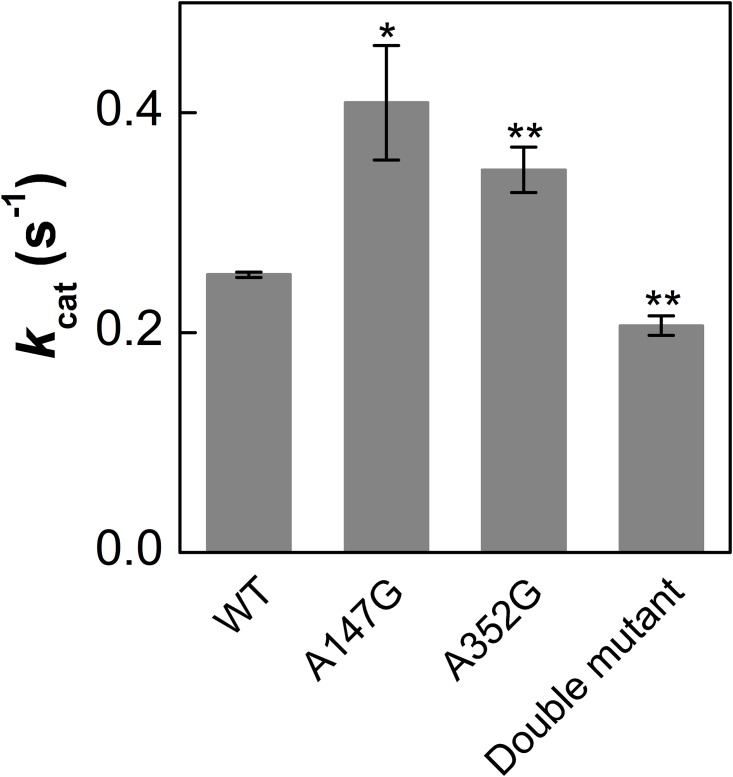
Fig 2. Comparison of the kcat of WT and various mutants of PtDXS based on LC-MS/MS based assay.
Each bar represents mean, error bars represent S.E. (n = 3). A147GPtDXS showed highest turnover number among all of them. Data with an asterisk (*) are significantly different from WT as determined by Student’s t-test. (*P < 0.05 and **P ≤ 0.01).

