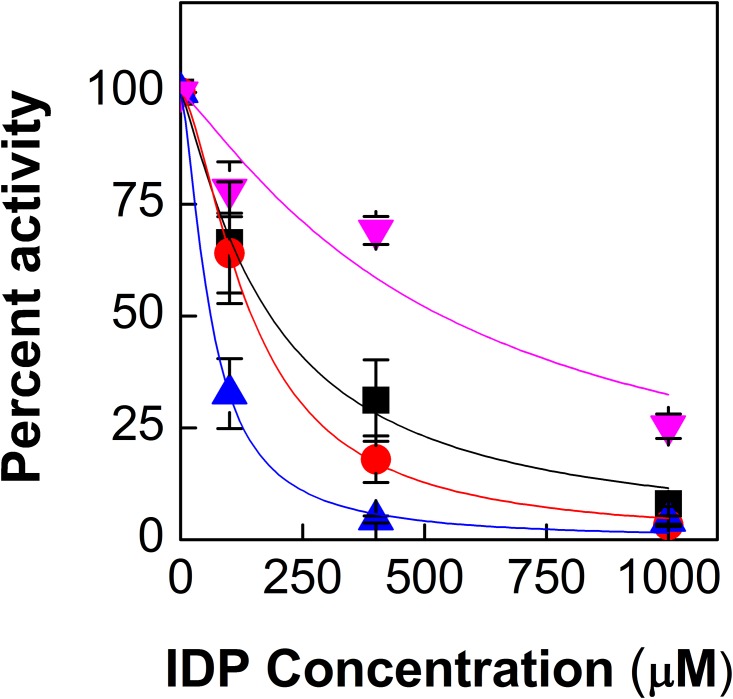
Fig 3. Effect of IDP on WT and different mutants of PtDXS.
Each data point represents mean, error bars represent S.E. (n = 3). Different symbols represent the experimental data points. The solid lines represent the fitted IC50 curves. Black, red, blue, and pink represent the activity of WT, A147G, A352G and A147G/A352GPtDXS respectively. A147GPtDXS/A352GPtDXS showed least inhibition by IDP.

