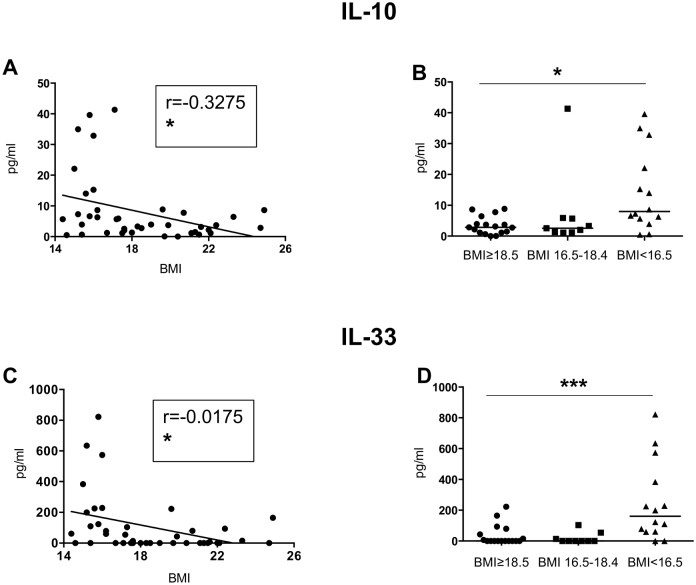
Fig 3. IL-10 and IL-33 levels in plasma.
The plasma from individuals with normal BMI (n = 17) and low BMI (n = 23, of which 9 were moderately malnourished and 14 were severely malnourished) was tested by Luminex for the levels of IL-10 and IL-33. Fig 3A, C and E show correlations between BMI and the different cytokines and statistical significance was established using a Spearman rank test. Fig 3B, D and F show cytokine levels between the individuals with a normal BMI, moderately malnourished and severely malnourished individuals and statistical significance was established using a Kruskal-Wallis test.

