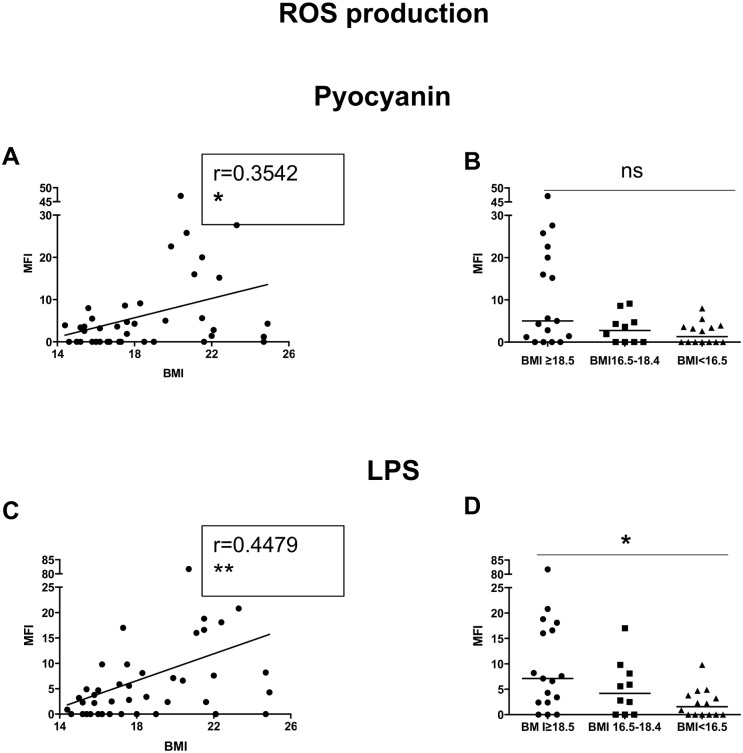
Fig 7. ROS production.
NDGs from individuals with normal BMI (n = 17) and low BMI (n = 23, of which 9 were moderately malnourished and 14 were severely malnourished) were isolated by double density gradient centrifugation NDGs and the capacity of NDGs to produce ROS was assessed by flow cytometry. Fig 7A and C show correlations between BMI and ROS production and statistical significance was established using a Spearman rank test. Fig 7B and D show ROS production between the individuals with a normal BMI, moderately malnourished and severely malnourished individuals and statistical significance was established using a Kruskal-Wallis test.

