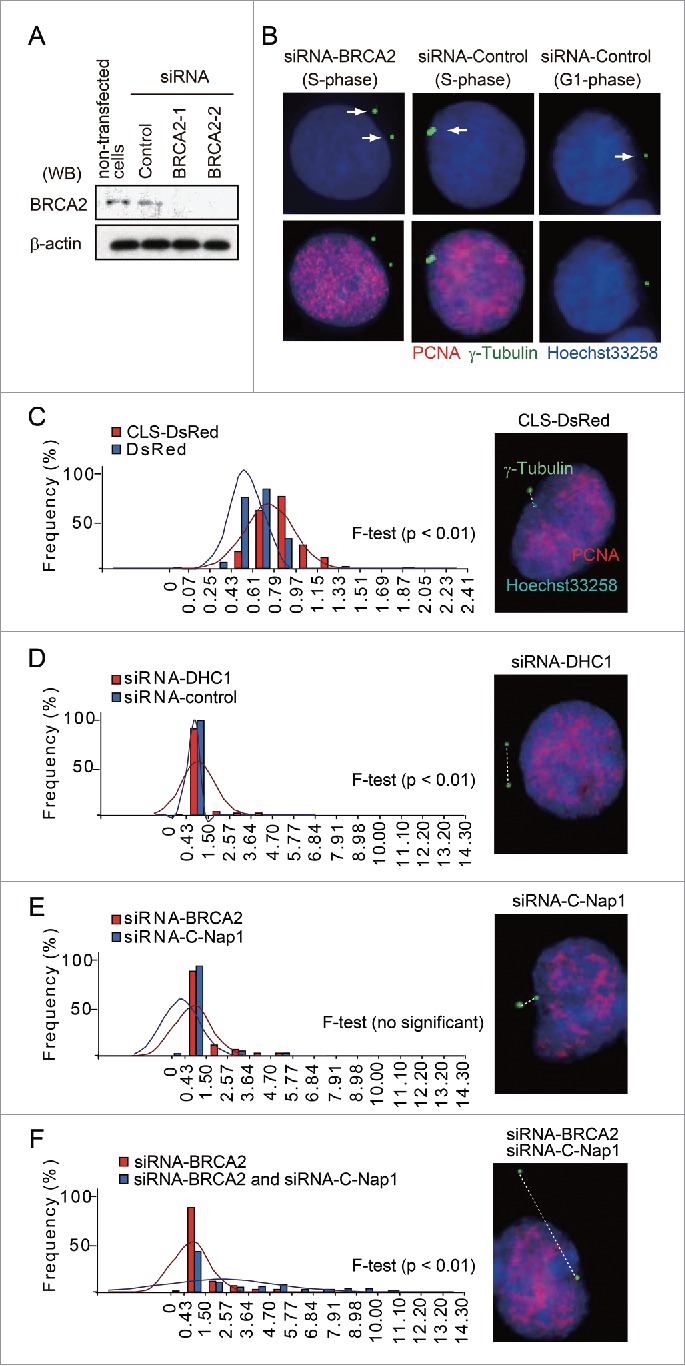
Figure 5.

BRCA2 mediates centrosome cohesion during S phase in HeLa S3 cells. (A) Western blot analysis of lysates prepared from mock-transfected cells or cells transfected with control or BRCA2 siRNA using anti-BRCA2 and anti-β-actin antibodies. (B) Immunofluorescence microscopy of control siRNA- and BRCA2 siRNA-transfected HeLa S3 cells using anti-γ-tubulin (green) and anti-PCNA (red) antibodies. Nuclei were stained with Hoechst 33258. Centrosomes are indicated by arrows. (C) The minimum distance between the centers of the centrosomes was measured using Adobe Photoshop CS3 software. Distances were measured in CLS-DsRed- and DsRed-transfected cells (both n = 100; p = 0.01). (D) Distances were measured in DHC1 siRNA- and control siRNA-transfected cells (both n = 100; p = 0.01). (E) Distances were measured in BRCA2 siRNA- and C-Nap1 siRNA-transfected cells (both n = 100; no significant difference). (F) Distances were measured in cells following double depletion of BRCA2 and C-Nap1 by siRNA, or by depletion of BRCA2 alone (both n = 100; p = 0.01). (C-F) Centrosomes were stained with Hoechst 33258 (blue) and anti-γ-tubulin (green), PCNA (red) antibodies, and the measured distance between centrosomes is indicated by the white dotted line.
