Figure 6.

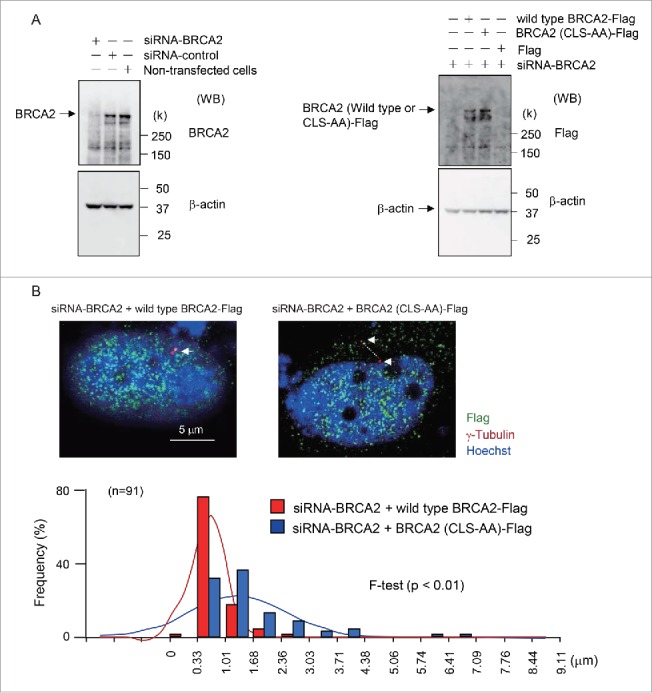
Expression of wild type BRCA2-FLAG and mutant BRCA2-(CLS-AA)-FLAG protein in endogenous BRCA2-knockdown HeLa S3 cells. (A) Western blot analysis showing BRAC2 and β-actin expression in cells transfected with control or BRCA2 siRNA (left panel). The expression of wild type BRCA2-FLAG and a mutant BRCA2–FLAG in which the S2887 and R2888 residues of the CLS were substituted with alanine (BRCA2-(CLS-AA)-FLAG) following siRNA-mediated depletion of endogenous BRCA2 in HeLa S3 cells (right panel). (B) Immunofluorescence microscopy of wild type BRCA2-FLAG- and BRCA2-(CLS-AA)-FLAG-transfected cells following BRCA2-knockdown using anti-γ-tubulin (red) and anti-FLAG (green) antibodies. Nuclei were stained with Hoechst 33258. Centrosomes are indicated by arrows. The minimum distance between the centers of the centrosomes was measured using Adobe Photoshop CS3 software. Distances were measured in wild type BRCA2-FLAG- and BRCA2-(CLS-AA)-FLAG-transfected cells (both n = 91; p < 0.01).
