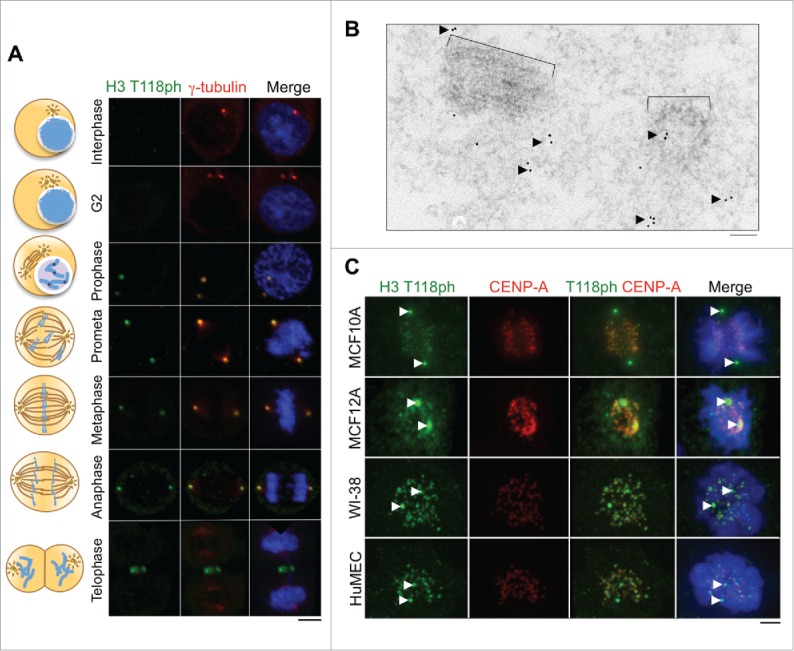
Figure 1.

Localization of H3 T118ph to the centrosome during mitosis in human cells. (A) Immunofluorescence analysis of H3 T118ph in HeLa cells. Scale bar = 10 μm. (B) EM images of a mitotic centriole pair with immunogold labeling of H3 T118ph. Black arrows indicate groups of gold beads in the pericentriolar material that surrounds the centriole pair. Brackets indicate centrioles. Scale bar = 100 nm. (C) Immunofluorescence analysis of prometaphase cells from the indicated cell lines. CENP-A marks the centromeres. Arrows mark centrosomes. Scale bar = 10 μm.
