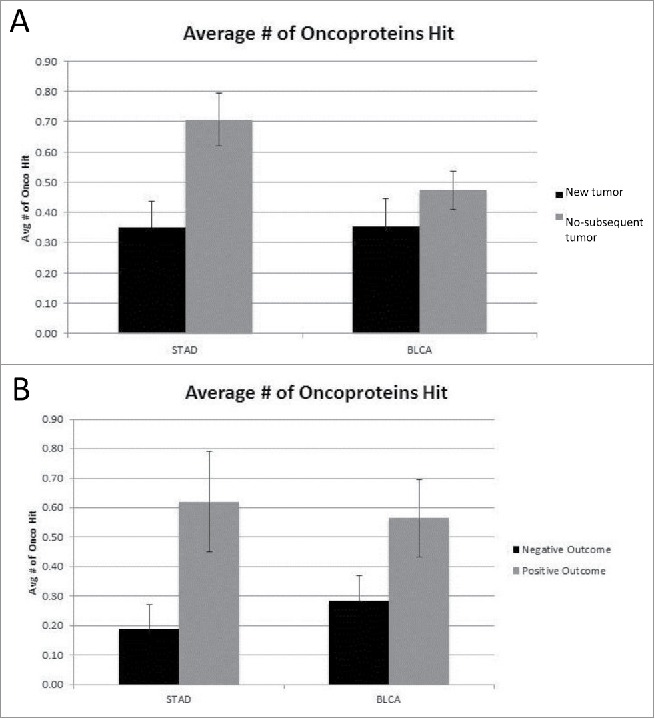
Figure 1.

(A) Average number of oncoproteins mutated for New Tumor vs. No-subsequent tumor (STAD p < 0.004, BLCA not significant) (detailed in SOM file labeled, “SOM Figures 1, 2 and 3, source file”). The new tumor group represents 74 barcodes and the no-subsequent tumor group represents 224 barcodes. (B) Average number of oncoproteins mutated for Negative vs. Positive outcome (STAD p < 0.026, BLCA not significant) (detailed in SOM file labeled, “SOM Figures 1, 2 and 3, source file”). The negative outcome group represents 32 barcodes and the positive outcome group represents 71 barcodes.
