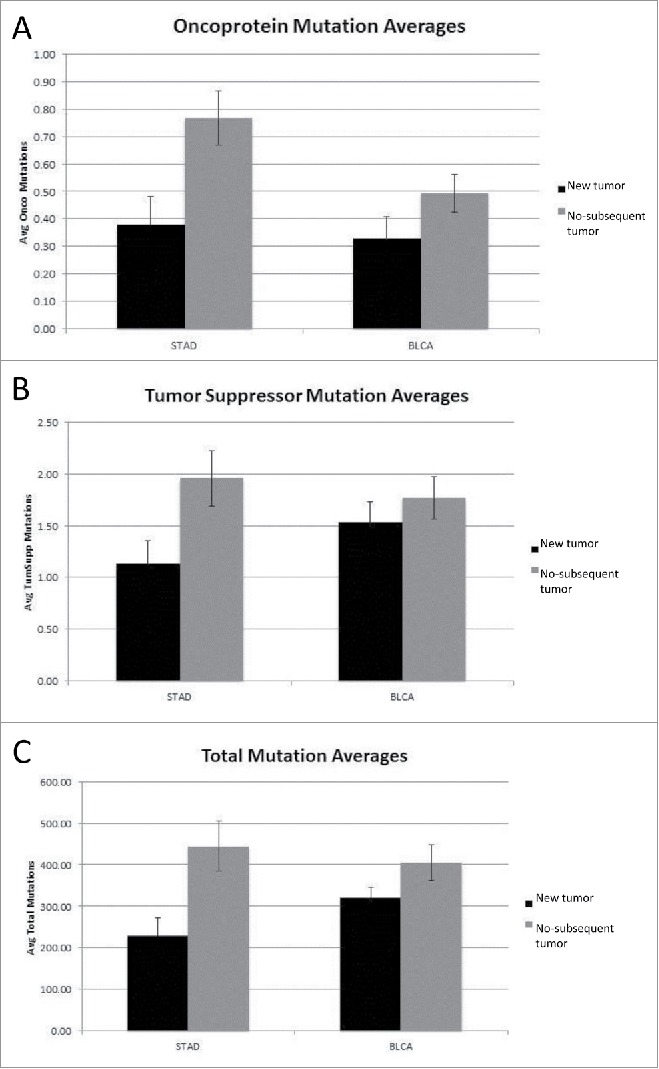
Figure 2.

(A) Oncoprotein mutation averages for New Tumor vs. No-subsequent tumor (STAD p < 0.007, BLCA not significant) (detailed in SOM file labeled, “SOM Figures 1, 2 and 3, source file”). The new tumor group represents 74 barcodes and the no-subsequent tumor group represents 224 barcodes. (B) Tumor suppressor mutation averages for New Tumor vs. No-subsequent tumor (STAD p < 0.019, BLCA not significant) (detailed in SOM file labeled, “SOM Figures 1, 2 and 3, source file”). The new tumor group represents 74 barcodes and the no-subsequent tumor group represents 224 barcodes. (C) Total mutation averages for New Tumor vs. No-subsequent tumor (STAD p< 0.004, BLCA not significant) (detailed in the SOM file labeled, “SOM Figures 1, 2 and 3, source file”). The new tumor group represents 74 barcodes and the no-subsequent tumor group represents 224 barcodes.
