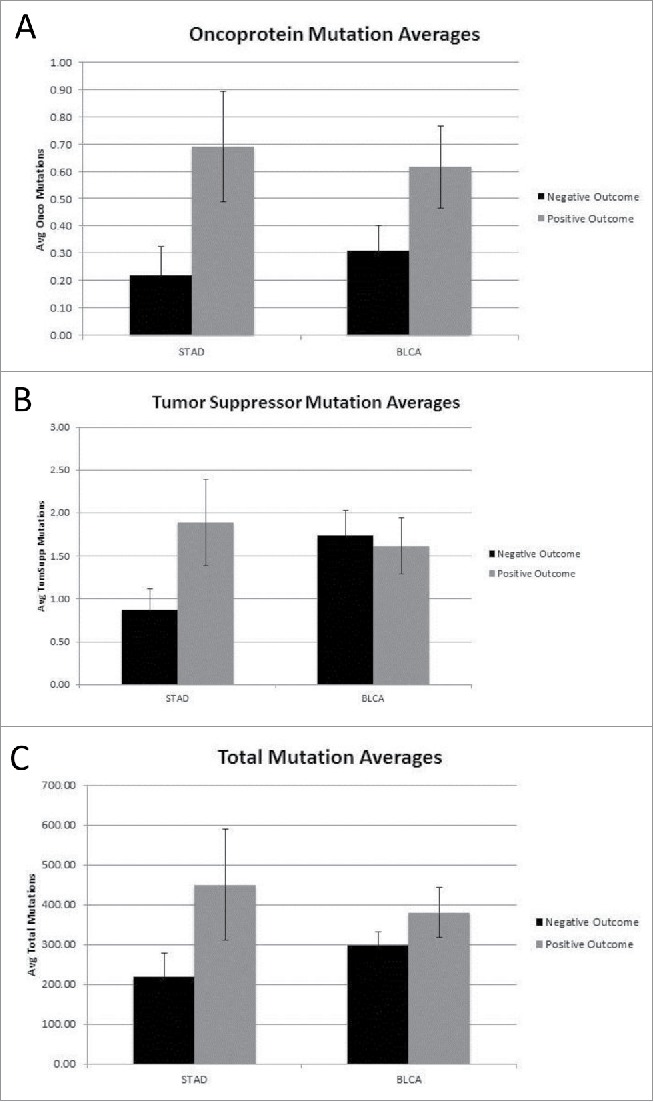
Figure 3.

(A) Oncoprotein mutation averages for Negative and Positive outcome (STAD p < 0.042, BLCA not significant) (detailed in SOM file labeled, “SOM Figures 1, 2 and 3, source file”). The negative outcome group represents 32 barcodes and the positive outcome group represents 71 barcodes. (B) Tumor suppressor mutation averages for Negative and Positive outcome (Both STAD and BLCA are not significant) (detailed in SOM file labeled, “SOM Figures 1, 2 and 3, source file”). The negative outcome group represents 32 barcodes and the positive outcome group represents 71 barcodes. (C) Total mutation averages for Negative vs. Positive outcome (STAD and BLCA are not significant) (detailed in SOM file labeled, “SOM Figure 1, 2 and 3, source file”). The negative outcome group represents 32 barcodes and the positive outcome group represents 71 barcodes.
