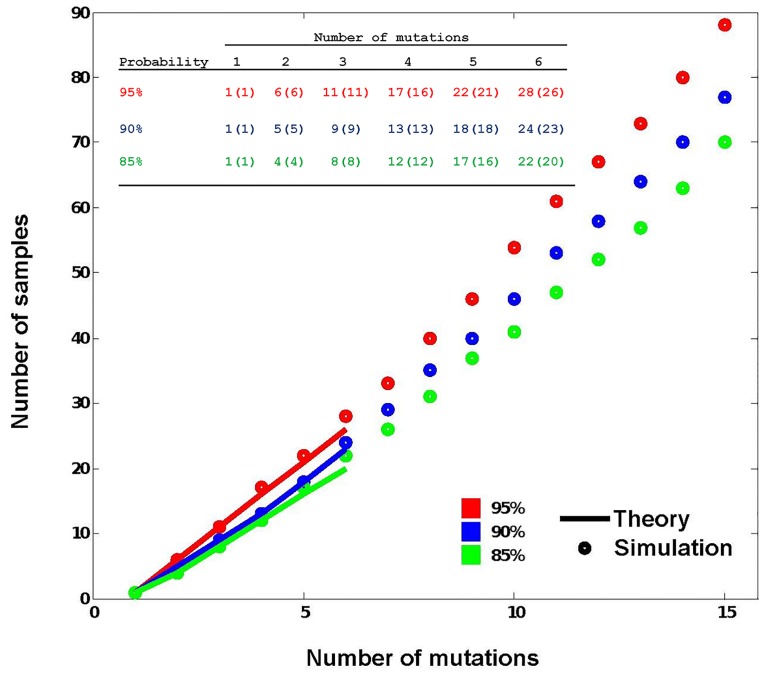
Fig 3. Data plots representing the obtaining (extraction) of all different individual mutations (samples to be extracted) from a given mix of mutations, assuming a stochastic distribution.
The x axis indicates the number of different mutations included in the one-tube-only mutagenesis reaction, and the y axis indicates the number of samples (bacteria colonies) to be analyzed to obtain at least one of each mutation with a certain probability (95%, in red; 90%, in blue; 85%, in green). Dots indicate data obtained from a computer-assisted simulation, up to a mix of 15 different mutations. Solid lines indicate the probability distribution plots (Theory) up to a mix of 6 different mutations. Numeric values (non-brackets, simulation; brackets, theory) are indicated in the inserted table up to a mix of 6 different mutations.

