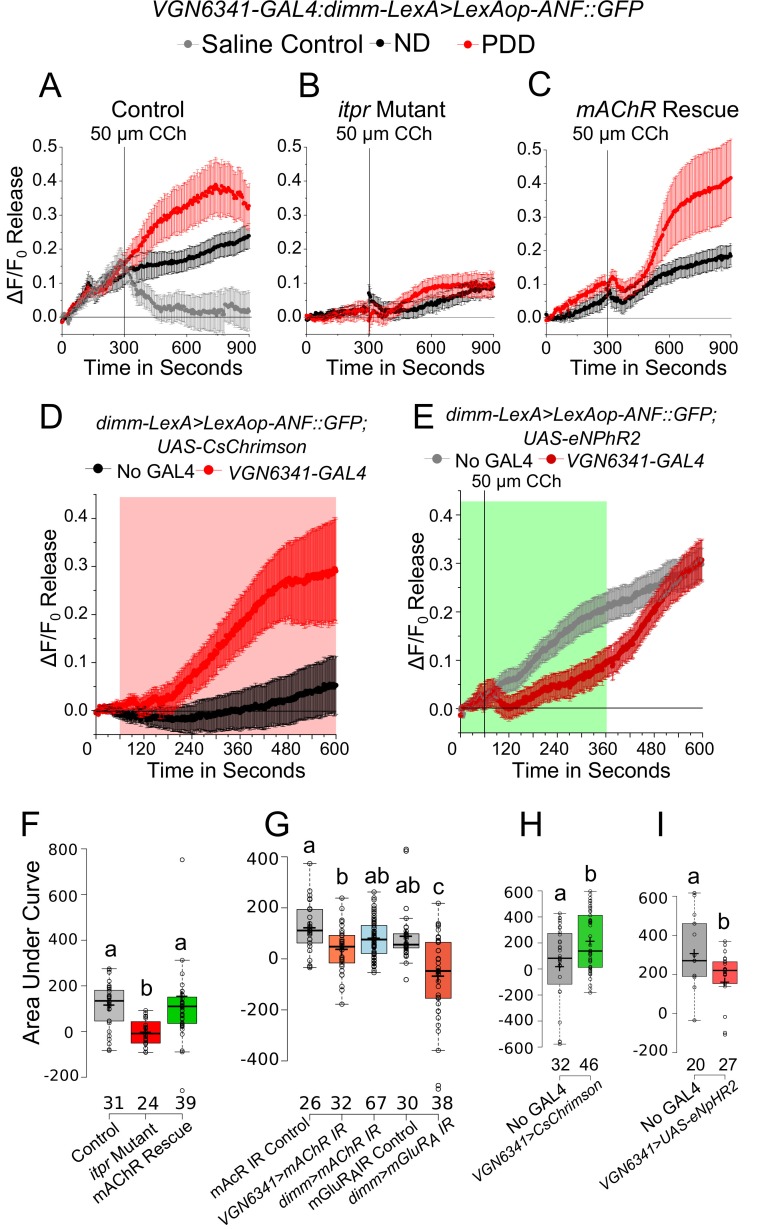
Figure 6. mAChR stimulation in glutamatergic neurons modulates enhanced peptide release from the mNSCs upon protein-deprivation.
(A–C) Traces represent a time series of mean normalized peptide release (ANF::GFP; ± SEM) from mNSCs of the indicated genotypes upon Carbachol (CCh) stimulation. D and E Traces represent a time series of mean normalized peptide release (ANF::GFP; ± SEM) on PDD from the mNSCs upon optogenetic activation of VGN6341-GAL4 (E) and using CCh under acute inhibition from the VGN6341-GAL4 (F). Red and green boxes indicate duration of activation and inhibition, respectively. (F–I) Box plots of CCh stimulated peptide release (ANF::GFP) quantified by area under the curve from the mNSCs of the indicated genotypes on PDD. Box plots and symbols are as described for Figure 3F. Bars with the same alphabet represent statistically indistinguishable groups (one-way ANOVA with a post hoc Tukey’s test p<0.05).

