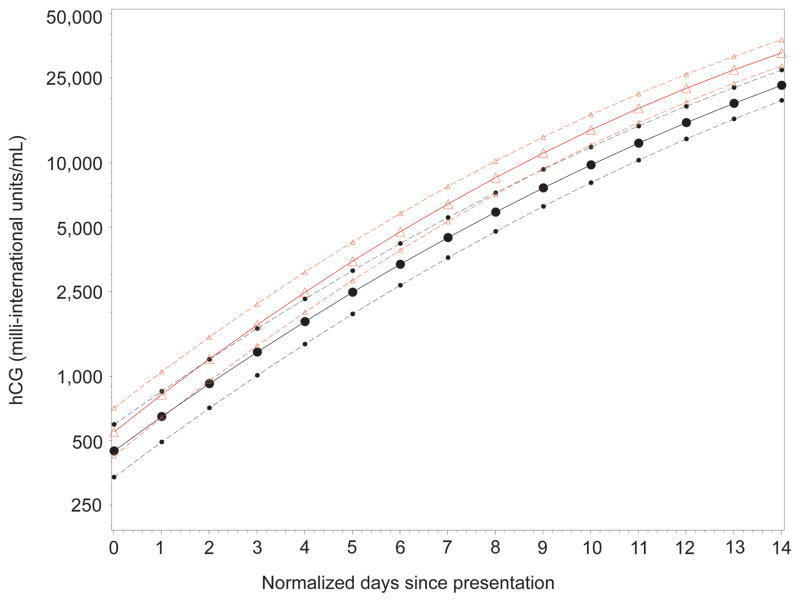
Figure 1.
Comparison of regression curves (assuming a quadratic model), subdivided by race, for estimating hCG rise in a viable intrauterine pregnancy. Plots show untransformed hCG values with logarithmic scaling. Triangles indicate the curve for African American women and circles indicate the curve for non-African American women. Dotted lines indicate the 95% confidence intervals.

