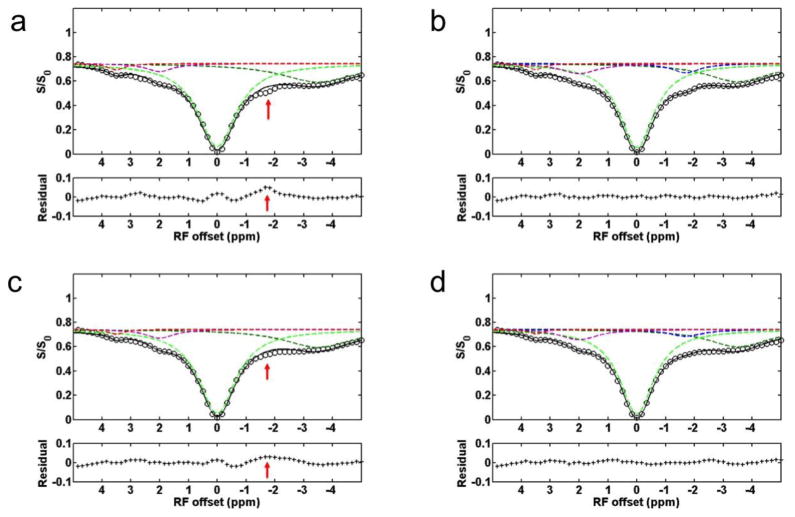
Figure 2.
The Z-spectrum, fitted peaks using Lorentzian function, and the residual from a representative rat brain with ischemic stroke. (a) and (b) show the 4-pool and 5-pool Lorentzian fitted results from the contralateral normal tissue, respectively. (c) and (d) show the 4-pool and 5-pool Lorentzian fitted results from the stroke lesion, respectively. Note the significantly bad residual ranging from −1 to −2 ppm (red arrow) in (a) and (c), but not in (b) and (d), indicating the presence of a possible MT pool in this range. Also note that the NOE(−1.6) signal is diminished in the stroke lesion compared with that in contralateral normal tissue.

