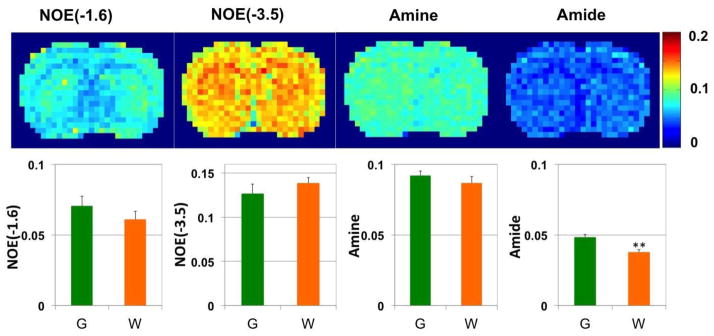
Figure 3.
pixel-by-pixel fitted amplitude maps from a representative healthy rat brain. The top panel: from left to right are NOE(−1.6), amide at 3.5 ppm, NOE at −3.5 ppm, and amine at 2 ppm. The bottom panels are statistical analysis of corresponding maps from 6 healthy rat brains (G: gray matter; W: white matter). **P<0.01

