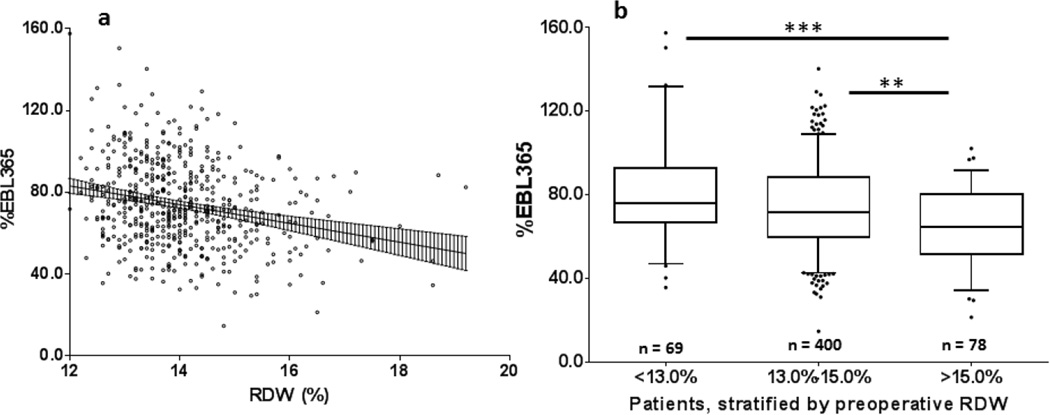
Figure 2.
Graphical depictions of the relationship between red cell distribution width (RDW) and percent excess body-mass index loss at one year postoperatively (%EBMIL365)
a- Simple linear regression analysis of %EBMIL365 vs. RDW revealed a significant relationship between the variables (P < .001, Pearson r2 = .06, n = 547). Linear regression line shown with 95% confidence band
b- Box-and-whisker plots of %EBMIL365, by preoperative RDW stratum. Whiskers represent 5th and 95th percentiles, box represents interquartile range, median represented by horizontal line within box, outliers represented as individual points. Kruskal-Wallis statistic = 18.6, P < .001, n = 547; **P < .01, ***P < .001.

