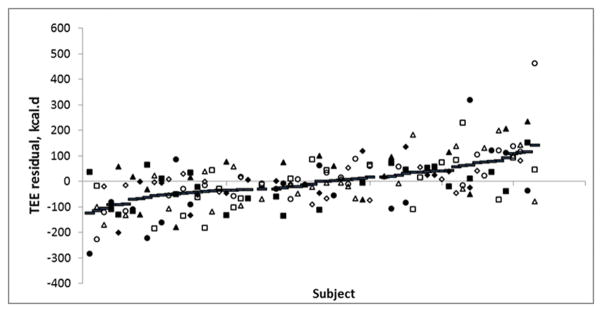
Figure 1.
TEE Residuals by subject, ranked by average TEE residual. Each subject is plotted with their individual TEE residual value as well as their average TEE residual (lines). Open and closed symbols are the low risk and high risk individuals, respectively. Diamonds, squares, triangles and circles indicate ages 0.25, 2, 4, and 6 years, respectively.

