Abstract
Spatial memory research has attributed systematic bias in location estimates to a combination of a noisy memory trace with a prior structure that people impose on the space. Little is known about intra-individual stability and inter-individual variation in these patterns of bias. In the current work we align recent empirical and theoretical work on working memory capacity limits and spatial memory bias to generate the prediction that those with lower working memory capacity will show greater bias in memory of the location of a single item. Reanalyzing data from a large study of cognitive aging, we find support for this prediction. Fitting separate models to individuals’ data revealed a surprising variety of strategies. Some were consistent with Bayesian models of spatial category use, however roughly half of participants biased estimates outward in a way not predicted by current models and others seemed to combine these strategies. These analyses highlight the importance of studying individuals when developing general models of cognition.
Keywords: memory, spatial, bias, working memory, individual differences
Memory of an object’s location in space is known to be subject to systematic distortions. There are many potential sources of bias in location memory, such as attentional asymmetries (Schurgin & Flombaum, 2014) and perceptual momentum (Freyd & Johnson, 1987), but the most studied is the perceptual organization that people impose on space. The common finding is that when participants are shown an object and then immediately asked to reproduce its location from memory, estimates are shifted away from the outer edges of a defined space and also away from internal axes of symmetry. According to prominent models such as the Category Adjustment Model (Huttenlocher, Hedges & Duncan, 1991; Huttenlocher, Hedges, Corrigan & Crawford, 2004) and Dynamic Field Theory (Simmering, Spencer & Schöner, 2006; Spencer & Hund, 2002), this bias results from a process that combines information about the stimulus location with information about the dominant reference frame that people apply to the space.
These and other studies of object-location memory typically use an analytic approach that combines results from participants and fits their collective data. Because this approach presumes that the collective provides a good representation of individuals, it can potentially lead to conclusions about cognition that do not apply to individual minds. In fact, little is known about how adults differ in these patterns of memory bias (but see Holden, Duff-Canning, & Hampson, 2014 for work on gender differences). Here we examine spatial memory biases by modeling participants individually, allowing us to examine the variability in how people structure a given space and in how they use that structure in memory. We then examine whether individual tendencies are consistent across horizontal and vertical dimensions of space and across two different spatial memory tasks. Finally, we investigate whether variability in spatial memory biases can be accounted for by differences in working memory capacity and adult age.
A common paradigm in spatial memory experiments involves showing participants a single object within a bounded spatial frame and then, after a short delay, asking them to recall its location. Studies have used a variety of objects and frames, such as a dot shown within a circle, rectangle, or other shape, an angled line within a 90-degree frame, a small toy buried somewhere in a rectangular sandbox, or a spaceship projected onto a tabletop. In addition, studies vary in the response procedure used: participants respond by marking the location on a piece of paper, by clicking with a mouse on a computer screen, by pointing to the location in physical space, or by discriminating whether a new location is the same or different from the one just studied. Despite the variety of approaches used, a common pattern of spatial memory bias has emerged in which estimates are shifted away from the outer edges of the spatial frame and away from internal axis of symmetry, as shown in Figure 1.
Figure 1.
Schematic diagram of biases in the V frame task from Engebretson and Huttenlocher (1996) and the rectangular frame from Huttenlocher, Newcombe, and Sandberg (1994).
The two prominent explanations of this bias are the Category Adjustment (CA) Model and Dynamic Field Theory (DFT). Rather than differentiating them, here we focus on their commonalities: both attribute these spatial biases to a combination of memory for the individual object location and a prior structure that people impose on the space. In the CA model, the structure is in the form of spatial categories (i.e., regions) that are bounded by the frame’s edges and internal axes of symmetry. The model proposes that location is encoded hierarchically, at both the particular and categorical level, and that these two levels are combined in a Bayesian fashion with the category acting as a prior distribution used to inform the uncertain memory of the particular location. Although this combination causes estimates to be biased toward category centers, it also makes them less variable than they would have been without the categories, and the net effect is to improve accuracy of reports. In Dynamic Field Theory, the structure is provided by the central midline of the space (or other perceptible features), which has inhibitory effects on the peak of activation produced by the target stimulus. This inhibition causes the peak of activation that was triggered by the stimulus in the excitatory working memory field to drift away from the midline, biasing estimates away from it.
An important finding in this literature is that such biases are more pronounced the longer a stimulus is held in memory, which indicates that the bias in responses results from post-encoding processes rather than from a bias in perception. Both models described above account for this finding. In the category adjustment model, longer delays lead to greater particular-level uncertainty, and thus greater weight is given to category information; in the DFT, the interactions between inhibitory layers and excitatory layers unfold over time, leading to greater cumulative impacts of reference-axis driven inhibition when delays are longer. Thus, increasing the delay selectively changes the representation of the stimulus, but not the structuring of the space.1 Drawing on these accounts, we conceptualize location estimates as the product of an assembly of information sources, including a noisy memory trace and a spatial organization. We model these sources respectively as a Gaussaian distribution centered on the true stimulus location and as normally distributed categories centered on the midpoint of each screen half, and we adopt the Bayesian mandate that more weight is given to the categories when the memory trace is less precise, thus producing more bias.
CAM and DFT have mostly been applied to data aggregated across individuals and not used to investigate individual differences. However, both models are properly models of intra-individual processes such as memory encoding, decay, and retrieval of spatial location. If individuals differ with respect to these processes, they will have different outcomes, and aggregating across individuals may lead to misleading conclusions (cf., Baloff & Becker, 1967). In fact, these models can be used to generate predictions about individual differences that have not been tested. Specifically, if bias results from the combination of prior structure with imprecise memory, then bias in spatial memory should be predicted by individual-difference variables that are theoretically related to memory precision. Here we examine two such variables, age and working memory capacity, by reanalyzing a data set that Siedlecki & Salthouse (2014) previously reported. Noting that measures of verbal memory are commonly included in cognitive batteries, but measures of spatial memory are not, Siedlecki & Salthouse introduced a location memory task as part of a large scale study of cognitive aging. Whereas their focus was on spatial memory accuracy, here we separate out two components of responses, precision and bias, in order to examine their connection to working memory and age.
In addition to testing whether working memory and age predict precision and bias, a second goal of this work is to characterize individual variation in spatial memory bias. The implicit assumption in prior work has been that the group mean well represents the behavior of individuals. Such an approach ignores the potential for diversity in the cognitive strategies individuals may adopt. Here we model participants individually and find that a substantial proportion of them show a systematic bias that is not well characterized by either DFT or CAM.
Working Memory Capacity Limits
As noted above, one way to examine the relation between precision and bias in spatial memory is to manipulate precision by varying the duration for which a location must be held in memory (e.g., Hund & Spencer, 2003; Huttenlocher et al., 1991). That approach treats variation between individuals as noise. The present study takes an alternative, complementary approach by examining whether precision and bias are accounted for by natural variation in the availability of cognitive resources. Specifically, we predict that those who perform worse on measures of spatial working memory capacity (SWMC) will tend to have less precision in memory and thus greater bias in responses when estimating a single location.
Working memory capacity is the ability to maintain information about the locations of objects that are no longer present, and it is usually assessed with tasks that require participants to retain information about multiple objects simultaneously. There is ample evidence that most people struggle when the number of items exceeds four (e.g., Luck & Vogel, 1997), and some have characterized this limitation as reflecting a fixed number of “slots” in visual working memory (Cowan, 2001; Luck & Vogel, 1997; Pashler, 1988). According to classic slot models, each slot has a fixed resolution and holds a discrete, all-or-none representation, and capacity limits become apparent when the number of items to be remembered exceeds the number of available slots. By such accounts, remembering a single location is well within normal capacity limitations, and so there is no reason to predict that precision on this task would be related to measures of working memory capacity. However, more recent accounts do predict this relationship. For example, updated slot models such as Zhang & Luck’s (2008) “slot + average” model allow that when remembering very few items, greater precision can be achieved by allocating multiple slots to code an individual item. Resource models (Bays & Hussain, 2008; Bays, Wu, & Hussain, 2011; Fougnie, Asplund, & Marois, 2010) and Dynamic Field Theory (Johnson, Simmering, & Buss, 2014; Simmering & Perone, 2013; Spencer, Perone & Johnson, 2009), hold that the resource of working memory can be flexibly allocated to remember fewer objects with greater precision or more objects with less precision: individuals who have more of this resource will perform better on measures of capacity and on measures of precision. The map-architecture account of spatial working memory capacity from Franconeri and colleagues (e.g., Franconeri, Alvarez & Cavanagh, 2013), suggests that being able to maintain more precise location information in memory produces the ability to store more simultaneous object locations in memory, i.e., that precision gives rise to greater capacity, specifically in the spatial domain (see also Lavenex, Boujon, Ndarugendamwo, & Lavenex, 2015). Thus, with the exception of the classic slot models, several models of visual working memory capacity predict that people who are able to hold more items in memory simultaneously will also be able to remember a single location more precisely.
Combining Capacity Limits with Memory Bias
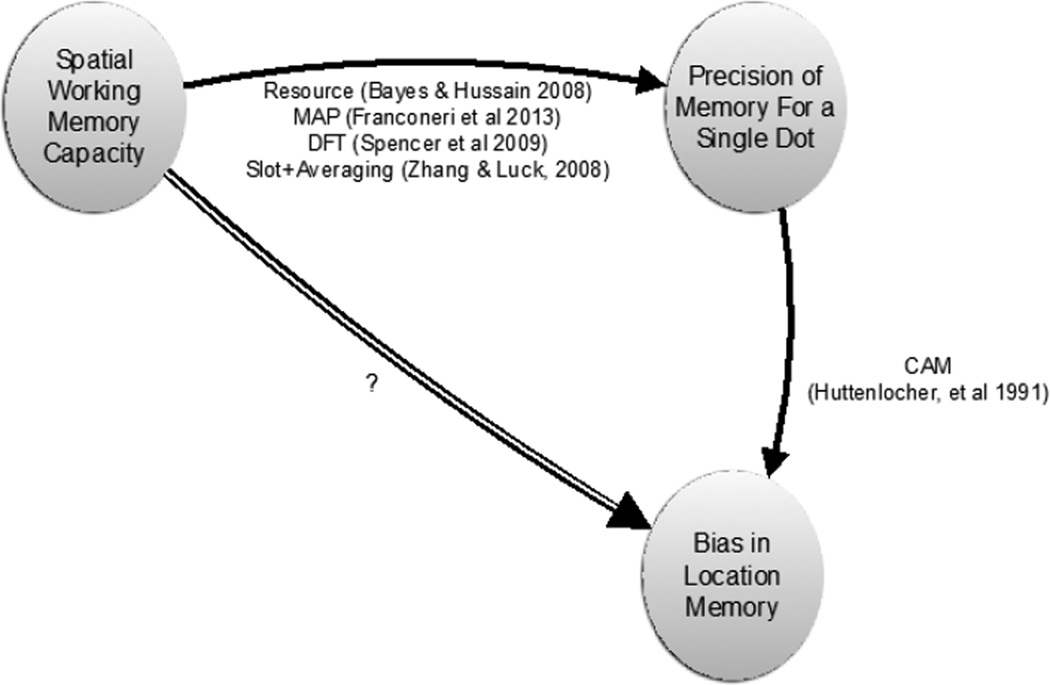
Recent models of working memory capacity share the prediction that the number of locations that can be simultaneously maintained in working memory is related to how precisely an individual location can be maintained (Figure 2). In turn, the Category Adjustment Model predicts a relationship between the precision of an individual’s memory for an item and the bias in their location memory, since CAM treats bias as the result of a rationally weighted combination of inexact memory and category information in which categories compensate for the noise in memory. If these two relationships hold, we can generate a new, previously untested prediction that those with lesser working memory capacity will also tend to show greater bias in memories of location (Figure 2, double arrow).
Figure 2.
The basic logic of the current paper combines recent findings of a relation between precision of memory for a single item and capacity limits with the relationship between precision and spatial memory bias, to newly predict a relationship (double line) between working memory capacity limits and spatial bias.
Although this prediction is directly motivated by the CAM, DFT could also be implemented in a way that would account for this result. According to DFT’s spatial precision hypothesis, low working memory is associated with more diffuse regions of activation around the target location in the field that represents spatial working memory. All else being equal, this greater diffusion would produce more bias in estimates because a larger proportion of the activation region would be near to the reference frame and thus subject to its inhibiting effects. However, the spatial precision hypothesis also suggests that with lesser spatial working memory capacity, the reference axis itself would produce more diffuse activation in working memory, and thus it would have weaker inhibitory effects. Thus it is not obvious that DFT would generate the same prediction as CAM about the relationship between bias in location memory and measures of spatial working memory capacity, but it could account for such a relationship by allowing the reference axes to be less susceptible than the target peak to the increases in diffusion that would stem from lower working memory capacity.
Another reason to predict a link between working memory capacity and spatial memory bias is that those with greater WMC are better able to control attentional focus (cf., Kane, Poole, Tuholski, & Engle, 2006; Bleckley, Durso, Crutchfield, Engle, & Khanna, 2003) and better able to maintain information in an active state across a delay and despite distractors (Unsworth & Engle, 2007). These conclusions are drawn from studies that use non-spatial measures of WMC such as operation span tasks, and they point to a general cognitive tendency rather than one that is specifically spatial. Assuming that a general difficulty maintaining information also applies to the maintenance of location, this would suggest that those performing worse on both spatial and verbal working memory tasks would have less precision and more bias in memory for location. To our knowledge, this has not been studied, but Siedlecki & Salthouse (2014) showed that accuracy on a simple location memory test is predicted by fluid ability (Gf), which is highly related to WMC (see Salthouse, Pink & Tucker-Drob, 2008), and suggested that this may be because Gf is related to general aspects of attention allocation. The present work builds on this finding by modeling precision and category use as components that contribute to accuracy and by examining the relation between these components and measures of working memory capacity.
Regardless of whether greater spatial precision leads to greater spatial working memory capacity or vice versa, there is reason to expect that those with lower SWMC will store individual object locations less precisely. To the extent that people use spatial structure to adjust for inexact memory, they would also be expected to show more pronounced biases.
The current study
The work presented here is a new analysis of data that was collected previously as part of a large study (n = 778) of cognitive aging (see Siedlecki & Salthouse, 2014). In addition to assessing adults on a variety of cognitive and emotional factors, the study included two spatial memory tasks. One had participants remember the location of a single dot at a time, and so was much like the tasks used in previous research to examine spatial memory biases, and the other involved a more challenging version in which participants were asked to retain three successive locations in memory. Although these tasks were designed originally to examine relations between cognitive functioning and spatial memory accuracy (see Siedlecki & Salthouse, 2014), the dataset also provides a unique opportunity to explore individual differences in spatial memory bias and precision.
There was a wide range of age in our sample, allowing us to examine whether advancing age may also lead to increased reliance on category structure. Prior studies present mixed evidence for this prediction. Some studies have shown that although keeping track of multiple objects becomes more challenging as people age, memory for an individual location or small number of locations is relatively preserved (e.g., Olson, et al., 2004; Noack, Lövden, & Lindenberger, 2012). In their analysis, Siedlecki and Salthouse (2014) found no effect of age on spatial memory accuracy once other cognitive factors have been taken into account. However, according to the “neural noise hypothesis” (Welford, 1984), aging is associated with increased noise in neural signaling, leading to less precise perceptual and memory representations. Consistent with this claim, Peich, Husain, and Bays (2013) examined precision of recall for single features (color or orientation) of an individual object and found that even when remembering only one object, estimates were less precise among older adults than younger ones. If memory for an individual object’s location is also less precise in older adults, they may also be expected to give more weight to category biases, and thus show increased bias in spatial memory.
Method
Participants
Participants consisted of 778 adults between the ages of 18 and 92 years (M = 54.7, SD = 14.5), recruited through flyers, newspaper ads and participant referrals.
Procedure
Participants completed two location memory tasks on computer screen with resolution 640 × 800 pixels per inch. In the single dot task, each trial began with a crosshair appearing in the center of a white screen for 500 ms followed by a dot (14-pixel diameter), which appeared for 1000 ms at a randomly selected location on the screen. The screen color in the background of the dot varied randomly between green, yellow and cyan, and participants were told to ignore the color for this task. The dot was followed by a 400-ms mask of moving dots on a white background, after which the screen returned to the color it had been during dot presentation and participants used the cursor to reproduce the dot’s location. In the multiple dots version of the task, three successive dots were shown, each with a different colored background and each followed by the 400-ms mask. Participants were then given a blank screen in one of the three colors, randomly chosen, and told to click on the location where the dot had appeared on the screen of that color. Thus the multiple dot task differs from the single dot task not only the number of items to be recalled, but also in that it requires binding of location to screen color.
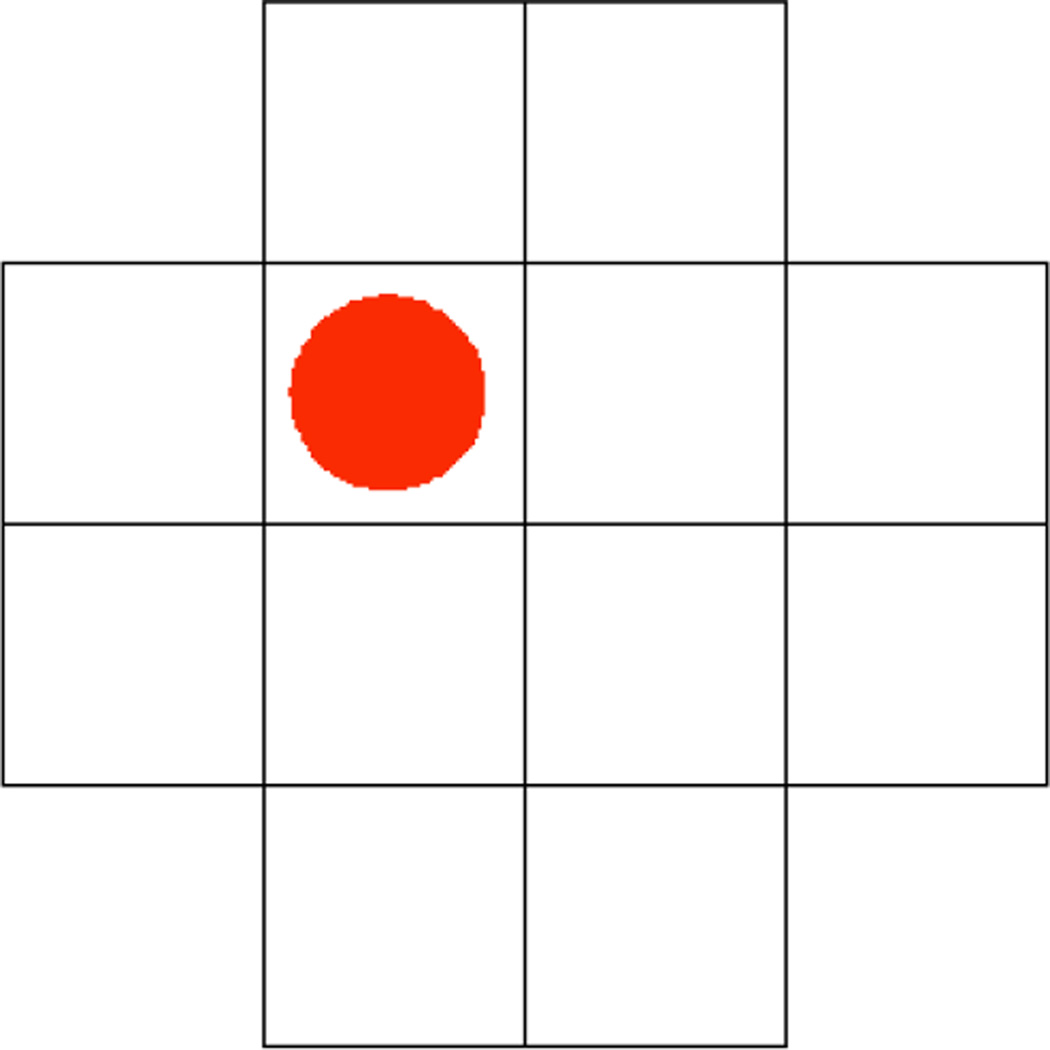
Participants completed many other tasks as part of the original study, but here we restrict our focus to two measures of working memory capacity, one spatial and one verbal, described in Salthouse et al. (2008) and Salthouse (2011). Spatial working memory capacity was assessed with a running span task in which participants viewed a series of marked locations in a 12-square grid, as shown in Figure 3. The locations to be remembered were indicated by a large red dot that appeared within one square at a time for one second followed by a 250 ms interstimulus interval. The sequence of locations varied unpredictably in length from four to 12 items and once it ended, participants used the mouse to click on the locations of the last four items seen, in their correct order. Verbal working memory capacity was assessed with a similar running span task, except that rather than seeing a sequence of locations, participants viewed sequences of letters. Performance in both tasks was assessed as the proportion of items recalled in the correct order from the last four items in the lists.
Figure 3.
A sample stimulus from the running span measure of spatial working memory capacity.
Analyses and Results
Analytical Approach and Model Checks
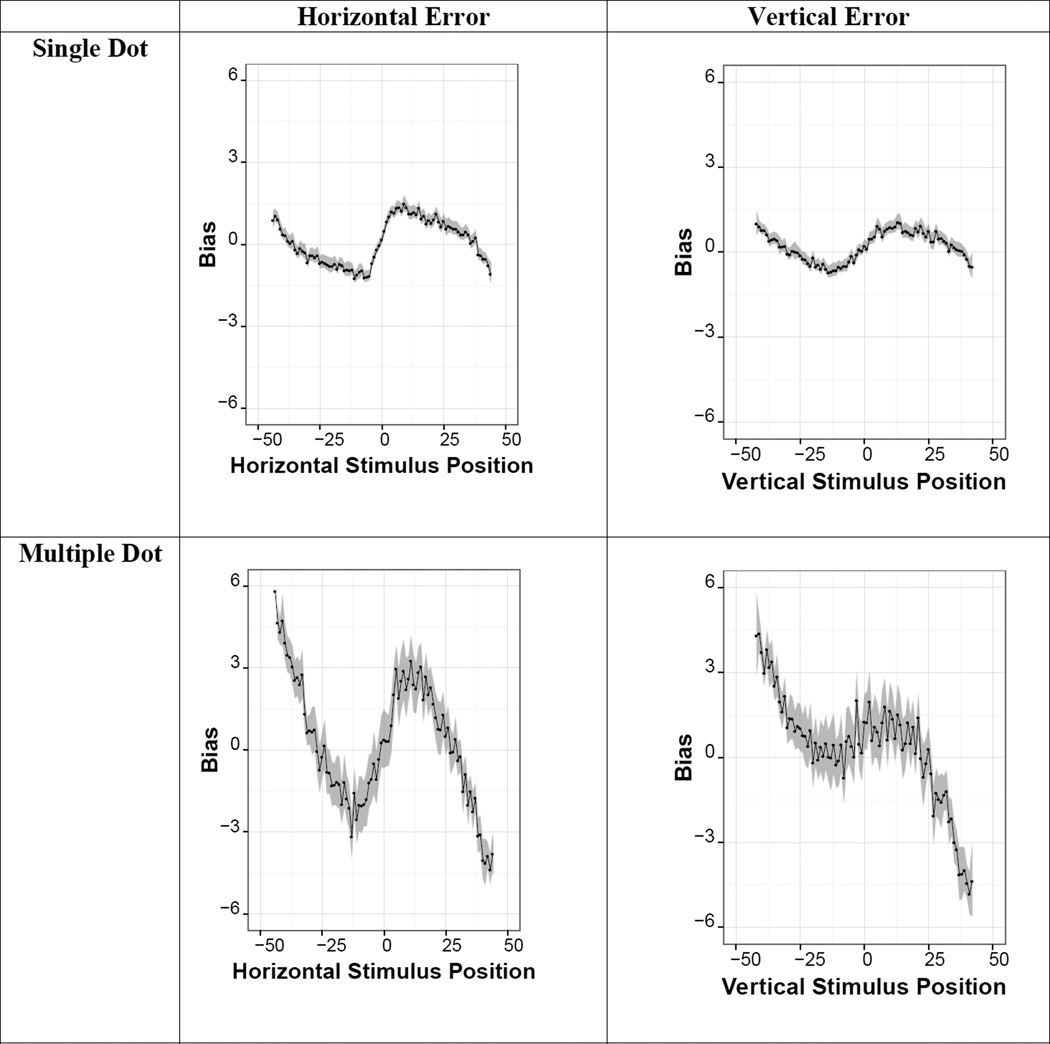
We employed continuous model expansion as an analytic technique in developing our final data model (Gelman, Carlin, Stern, & Rubin, 2014). In this process, one begins with a simple model of the data, and develops more general models that contain the simple model as a special case, iterating this process until the data is adequately captured for the present concerns of the modeling activity (see appendix for more details). Bias data from both the single-dot and multi-dot tasks is shown in figure 4. Bias is the signed difference between the location of the stimulus position and the location of the response position, in pixels. In the horizontal dimension, positive bias indicates a rightward shift and negative bias a leftward shift; in the vertical dimension, positive bias indicates an upward shift and negative bias a downward shift. The results in figure 4 are consistent with previously published findings: estimates are biased away from the outer edges of the screen and away from the horizontal and vertical axes of symmetry. Because the overall pattern fits reasonably well the predictions of the category adjustment approach we began analyzing our data with a straightforward category adjustment model, predicting normally distributed memory traces, and normally distributed categories at the midpoint of each screen side. An important parameter in this model is the category weight: responses are a weighted average of the stimulus memory trace and the nearest category. The category weight is the proportion of the response contributed by the category: a value of 1 reflects moving each dot fully to the center of the category (e.g., the midpoint of the left and right screen halves), 0 indicates no use of the category at all, and 0.5 reflects responses that on the whole average the position of the central category and the actual dot location. Full details of this approach are provided in the appendix.
Figure 4.
Aggregated participant bias against horizontal spatial position. Although a clear category effect is apparent in both the single-dot (left) and multi-dot tasks (right), in both cases responses are systematically biased outward from the predictions of the pure category adjustment model.
However, this approach did not provide an adequate fit to the data; in the category adjustment approach, the midpoints of the left and right sides of the screen are presumed to be the central members of the category, and so should show no bias. As can be seen in Figure 4, in this experiment the actual unbiased points (i.e., the locations toward which estimates are biased) are not at the screen-half centers (values −25 and 25 on the x axis), but are shifted outward toward the screen edges in at least three of the four cases. Furthermore, examination of data from individual participants indicated that while some participants matched closely the predictions of the category adjustment account, many did not. Indeed, some participants appeared to systematically shift all responses toward the screen’s outer edges.
In the DFT model of spatial memory, bias has been characterized as repulsion from the midline reference axes rather than toward category prototypes, and so at first glance it might seem that DFT would offer a better account than CAM for the systematic outward bias we observed here. However, there are two reasons why DFT also does not easily account for this bias. First, the DFT predicts that the repulsion away from the midline will be greatest for locations near the midline and will fall off as distance from the midline increases, but the outward bias we observe does not have this characteristic. In fact, it appears that outward bias is constant or increasing with distance from the center, and this pattern is inexplicable under both CAM and DFT. In addition, we note that under DFT, the outer edges of the screen would also be expected to have repulsive effects. In fact, because they are visibly present features, they might be expected to have even stronger repulsive effects than the midline structure, which is not visibly marked (Simmering & Spencer, 2007), and that should produce a countervailing inward bias, especially for stimuli in the outer region of the space.
To capture this systematic outward bias in the model, we added an additional feature, which we term a fixed outward bias. Each response combines, in some fitted proportion, a memory trace that is systematically shifted from its true location by the fixed outward bias factor and which has some degree of precision (i.e., lack of variability), along with a corrective bias derived from category adjustment. In addition, we employed weighted categorization near the screen center, to account for the roughly 20% of the screen in which bias is weaker than the simplest CA model would predict. This weighting comes from the relative probability of each of the categories based on their variance (See appendix for details), and did not involve any additional parameters.
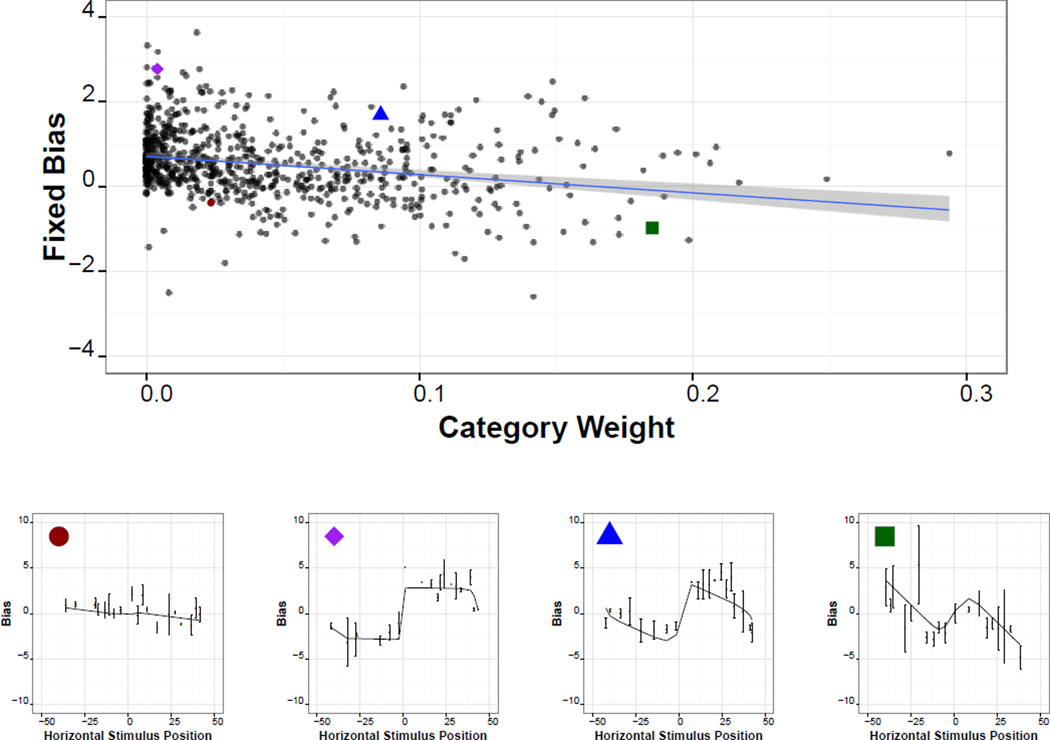
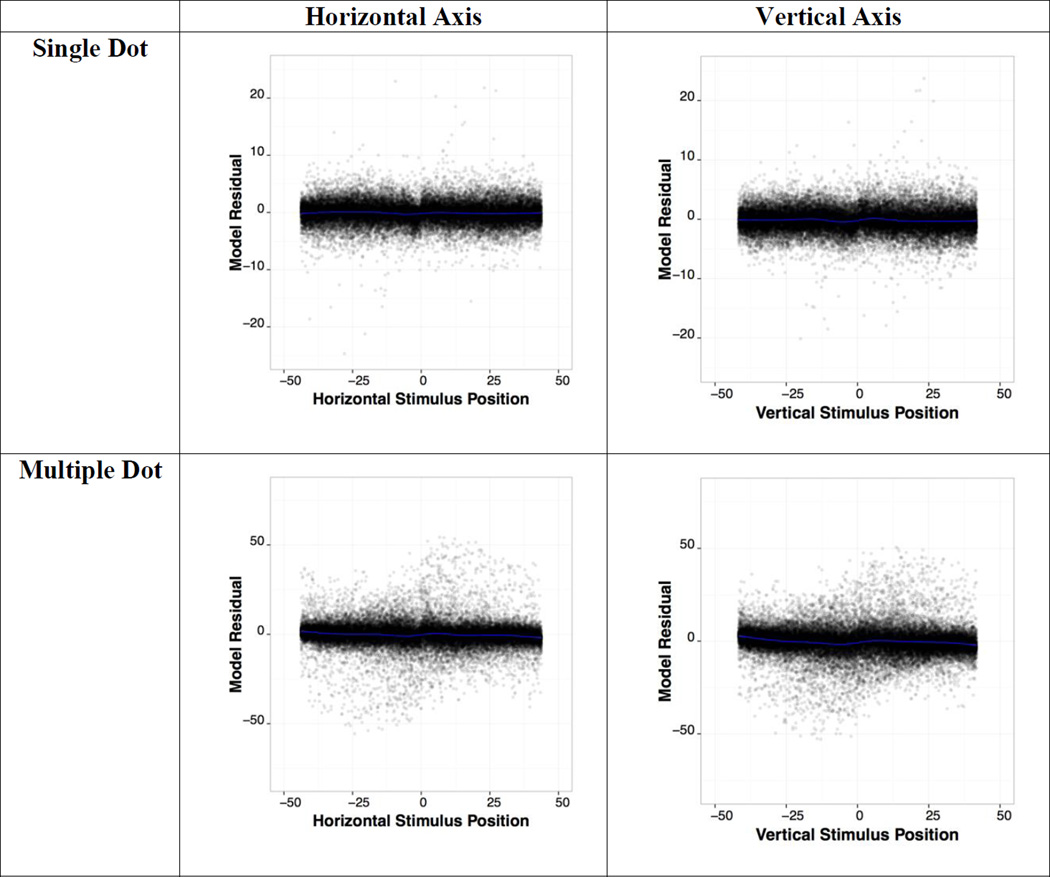
This combined model was evaluated by nested model comparison. Specifically, we conducted two chi-squared model comparisons using the fit of each model to each individual as a single data point, comparing the combined model to two simpler nested models: one that included only the fixed outward bias, and one that included only the category weight. Across participants, the mixture model significantly improved fit over both simpler models (vs. CAM: χ2 (757) =2337, p < 0.00001; vs. fixed outward bias: χ2 (757) =3257, p < 0.00001). Of course, because the mixture model contains the other models as special cases, the mixture model fit best for each subject. To account for this, we chose the best model for each individual based on BIC values. The model with the lowest BIC value was CAM for 40 % of subjects, the pure outward model for 39%, and the mixture model for the remaining 20% of participants. Although this provides a concise way report the variety of strategies participants use, in our analyses we do not classify people trichotomously because the actual parameter fits were relatively unimodal (see Figure 7). For analysis, we used model fits from the mixture model for all participants. The final model residual was considered acceptable (Figure 5). See the appendix for a detailed mathematical description of the resulting model.
Figure 7.
Parameter estimates for individual participants (top), along with response patterns of a few selected representative individuals (bottom four panels). As can be seen, behavior patterns of individuals are systematic and variable, with some individuals showing much less use of the categories than others, and showing different patterns of inward or outward bias.
Figure 5.
Plot of residuals from final fitted model. As can be seen, the model residuals are quite flat across the range of stimuli, consistent with noise in individual judgments. Slight deviations include an s-shape residual near the screen center and skew at the boundaries. Perhaps the most salient structure is the diagonal line running approximately through the center of the screen in all four plots. This seems to represent trials in which a participant simply placed responses near the center of the screen. Although visually salient, these patterns formed a small proportion of overall trials.
Data from each participant was fitted to this model, separately for the single-dot and multi-dot tasks, and also (to provide an estimate of reliability) the horizontal and vertical dimensions. For each participant, we examined three of the resulting parameters: memory precision (i.e., the lack of variability in the memory trace), category weight, and fixed outward bias. It should be noted that our measure of memory precision differs from the response accuracy measure examined in earlier work (Siedlecki & Salthouse, 2014) in that it is a model-derived parameter representing one theoretical determinant of accuracy. That is, we treat memory precision, category weight, and the fixed outward bias factor as components that combine to produce responses, and thus each can contribute to response accuracy. Throughout what follows, we used a Monte Carlo approach to compare tasks and estimate individual differences parameters. For each test (using general linear models or differences in means), we created 10,000 random resamplings of the original data, and compared our difference against those created by the Monte Carlo simulations to estimate the probability of the obtained results under the null hypothesis.
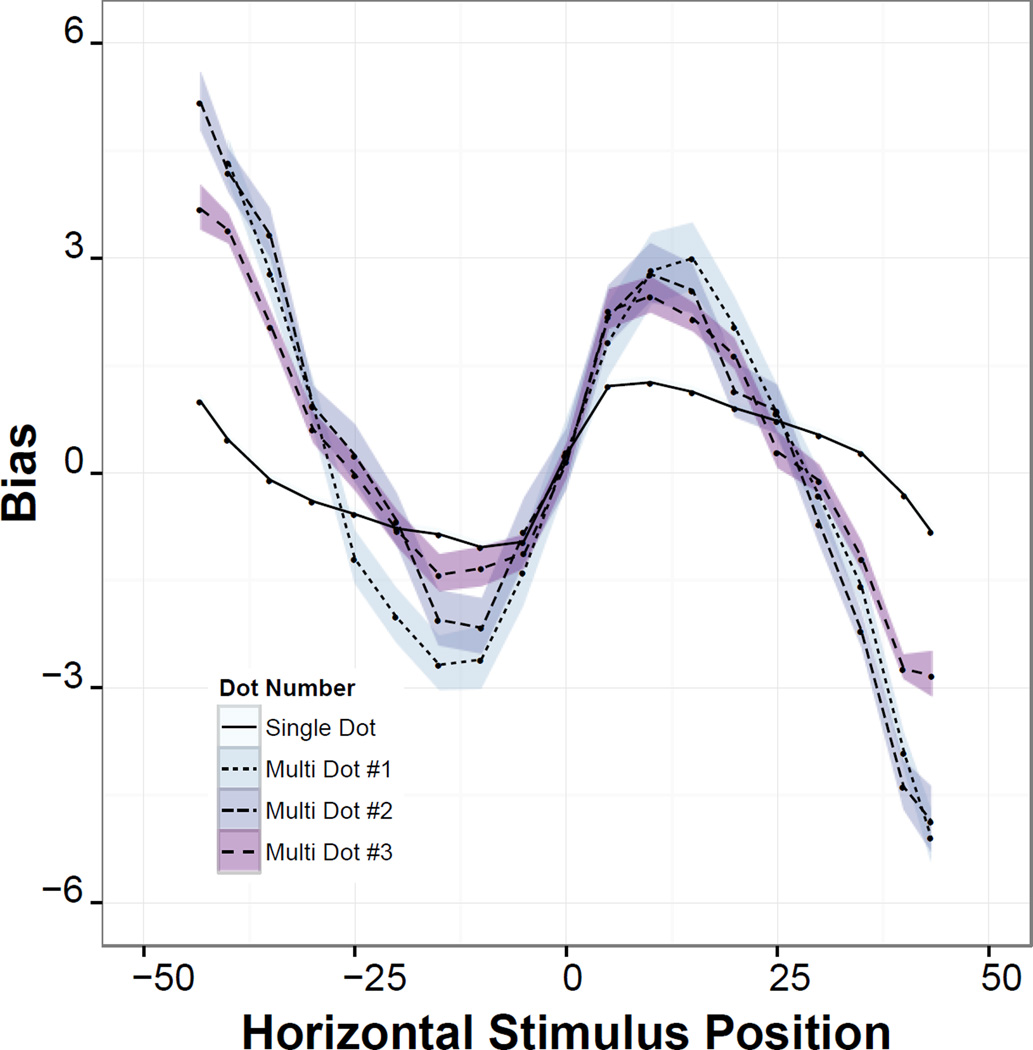
Before addressing variation between individuals, we first verify that the data aggregated across individuals is consistent with findings from prior work. Specifically, precision should decrease and category weight should increase the longer a stimulus is held in memory. Because the multiple-dot task presented three stimuli in succession, the first dot in the series has the longest retention interval and the third dot has the shortest, and indeed, Siedlecki & Salthouse (2014) reported that overall error was greatest for the first dot and least for the third. By analyzing separate sources of error, we show that this effect is captured by increased category weight and decreased precision for locations presented earlier in the sequence (Table 1). In other words, the overall pattern of bias shown in Figure 4 is more pronounced for dots that appeared earlier in the sequence, as shown in Figure 6. We also note that the single-dot task, which Siedlecki and Salthouse showed was performed more accurately than the multiple-dot task, showed overall greatest precision and least category weight. Table 1 also shows that the fixed outward bias is greater with longer retention intervals.
Table 1.
Fitted Parameters by Task and Dot
| Task | Mean (95%CI) precision |
Mean (95%CI) category weight |
Mean (95%CI) fixed outward bias |
|---|---|---|---|
| Multi Dot 1 | 0.16 (0.16, 0.17) | 0.18 (0.17, 0.19) | 2.90 (2.65, 3.13) |
| Multi Dot 2 | 0.19 (0.18, 0.20) | 0.18 (0.17, 0.20) | 1.67 (1.43, 1.88) |
| Multi Dot 3 | 0.27 (0.26, 0.28) | 0.16 (0.15, 0.17) | 0.77 (0.60, 0.94) |
| Single Dot | 0.61 (0.59, 0.63) | 0.04 (0.03, 0.04) | 0.40 (0.35, 0.44) |
Figure 6.
Rightward bias in responses by horizontal distance from screen center, separated by task and dot number. As can be seen, not only does overall error decrease for later dots compared to earlier dots, the systematic bias (the slope of the descending line) decreases as well. For the single dot case, bias is much smaller than any multi-dot case.
Variability across individuals
Our first goal was to examine the degree to which individuals differ from each other in their spatial memory performance. Although aggregate behavior reflected some mixture of a constant bias (typically outward) and category adjustment, individual participants behaved quite differently from one another. To illustrate, we consider horizontal bias in the single-dot task. Figure 7 presents estimates for individual participants of category weight and fixed outward bias. Recall that for estimated category weight, a value of 1 reflects moving each dot fully to the center of the category (e.g., the midpoint of the left and right screen halves), 0 indicates no use of the category at all, and 0.5 reflects responses that on the whole average the position of the central category and the actual dot location. For the fixed outward bias factor, values greater than 0 indicate outward bias and values less than 0 indicate inward bias. As is apparent from Figure 7, increased category use weakly negatively correlated with fixed outward bias (r = −0.22, p < 0.0001). Qualitatively, several different patterns emerged. A few participants showed a systematic inward bias (red circle); more showed a systematic outward bias (purple diamond). A few showed more-or-less typical category adjustment behavior (green square) only. Other participants (blue triangle), in our analysis, seemed to combine these two strategies.
Participants responding with a generally systematic inward bias have sometimes been thought of as adjusting toward a single central category, such as in young children (Huttenlocher Newcombe & Sandberg, 1994). This is a plausible explanatory account of the behavior of participants such as the red circle, but is not included in this model directly because it cannot be practically distinguished from an inward fixed bias (that is, a fixed bias value less than 0).
Reliability of the Fitted Parameters
We next examined the reliability of the parameters of interest within individuals. Specifically, we examined whether performance in the horizontal dimension was correlated with performance in the vertical dimension. Although these responses are in principle independent, the underlying cognitive constructs are not. In particular, memory precision would be predicted to be consistent across dimensions. In addition, we assessed intra-individual correlations between the single-dot and multi-dot tasks. This model fits four parameters to each individual’s behavior with both the single and the multiple dot tasks, with only 40 unique data points per model fit. Although the model is fairly well-constrained, and only three of those parameters are of interest here, we nevertheless considered it important to estimate the reliability of these fits.
As Table 2(a) indicates, memory precision is highly consistent across dimensions within a given task. Not surprisingly, individuals who were estimated to have greater memory precision in the horizontal dimension were estimated to have greater memory precision in the vertical dimension, with correlations around .8 within each version of the task. There are also moderately high (i.e., above .5) correlations between the memory precision parameters estimated from the single dot task and those estimated from the multiple dot task, suggesting a common feature of memory precision across the two tasks.
Table 2.
Correlations Between Tasks and Spatial Dimensions for Memory Precision (a), Fixed Outward Bias (b), and Category Weight (c).
| (a) Memory Precision | ||||
|---|---|---|---|---|
| Memory Precision | Single Horizontal |
Single Vertical |
Multiple Horizontal |
Multiple Vertical |
| Single Horizontal | 1 | .79*** | .55*** | .50*** |
| Single Vertical | 1 | .54*** | .52*** | |
| Multiple Horizontal | 1 | .80*** | ||
| Multiple Vertical | 1 | |||
| (b) Fixed Outward Bias | ||||
| Fixed Outward Bias | Single Horizontal |
Single Vertical | Multiple Horizontal |
Multiple Vertical |
| Single Horizontal | 1 | .54*** | .31*** | .19*** |
| Single Vertical | 1 | .21*** | .28*** | |
| Multi Horizontal | 1 | .51*** | ||
| Multi Vertical | 1 | |||
| (c)Category Bias | ||||
| Category Bias | Single Horizontal |
Single Vertical | Multiple Horizontal |
Multiple Vertical |
| Single Horizontal | 1 | .48*** | .27*** | .25*** |
| Single Vertical | 1 | .23*** | .36*** | |
| Multi Horizontal | 1 | .34*** | ||
| Multi Vertical | 1 | |||
The model integrates the precision of memory and the presumed category structure to create an estimated overall level of categorical bias. This bias is a proportion, reflecting the proportion of the distance between the stimulus and the category by which the response are deformed. A category bias of 1 reflects using just the category when making responses, while a category bias of 0.5 reflects averaging the stimulus location and the category. Table 2(b) reports the correlations across dimensions and tasks for this parameter. Although correlations were lower than for precision (reflecting, perhaps, variability in category structures), the same patterns held as in the other parameters, with cross-task correlations ranging from .23 to .36.
Fixed outward bias was also estimated in all four data sets. Less is known about the sources and modulators of this bias, so we did not have strong predictions about how it would change across task or direction. As shown in Table 2(c), all four estimates were positively correlated, and were statistically significant. However, the actual correlations were relatively low between tasks (ranging from .19 to .31), suggesting that people may have adopted somewhat different strategies for the single and multi-dot tasks (cf. Crawford & Jones, 2011).
Individual Differences in Dot Location Bias
Because of the positive correlations across dimensions, and because we did not have any strong predictions about task dimensions, we collapsed the vertical and horizontal direction fit parameters for each task into a single average measure for analyses of individual and task differences.
Individual difference patterns were assessed by applying linear models to the results of the parameter fits. Since one parameter set was fitted to each individual, parameter fits can be used as a measure, in the same way that using the mean of a set of response times can be taken as extracting the parameter of a best-fitting normal model. Here we consider how memory precision, category weight, and fixed outward bias factor are predicted by several particular individual parameters: spatial working memory, verbal working memory, and age.2 For the multiple dot task, we also included as a predictor the relevant parameter estimate from each participant’s performance in the single dot task in order to determine whether our predictors account for variance that is unique to this more complex task. Because distributions of the parameters cannot be regarded as normal, we evaluated statistical significance in these models using a bootstrap analysis with 10,000 replications per model. Because we evaluated four potential predictors across three dependent measures for each parameter of independent interest, we used a Bonferroni correction for each analysis, so that a test was considered significant at the 0.05 level if the probability was less than 0.0042. These results are presented in Table 3.
Table 3.
Individual Variable Predictors of Model Parameters
| Measure | Mean | 95%-CI | Predictor (standardized β) | |||
|---|---|---|---|---|---|---|
| Spatial Capacity |
Age | Letter Capacity |
Single Dot Parameter |
|||
|
Memory Precision |
||||||
| Single Dot | 0.61 | [0.59, 0.63] | .35*** | −.12* | .06 | N/A |
| Multiple Dot | 0.17 | [0.17, 0.18] | .39*** | −.04 | .14** | .37*** |
|
Category Weight |
||||||
| Single Dot | .05 | [.05, .056,] | −.24*** | .10 | .04 | N/A |
| Multiple Dot | .15 | [.137, .155] | −.32*** | .03 | −.07 | .29*** |
|
Fixed Outward Bias Factor |
||||||
| Single Dot | 1.02 | [1.01, 1.02] | −.10 | −.11* | −.05 | N/A |
| Multiple Dot | 1.14 | [1.13, 1.16] | −.31*** | −.03 | −.08 | .30*** |
indicates p < 0.004,
indicates p < 0.0008;
indicates p < 0.00008.
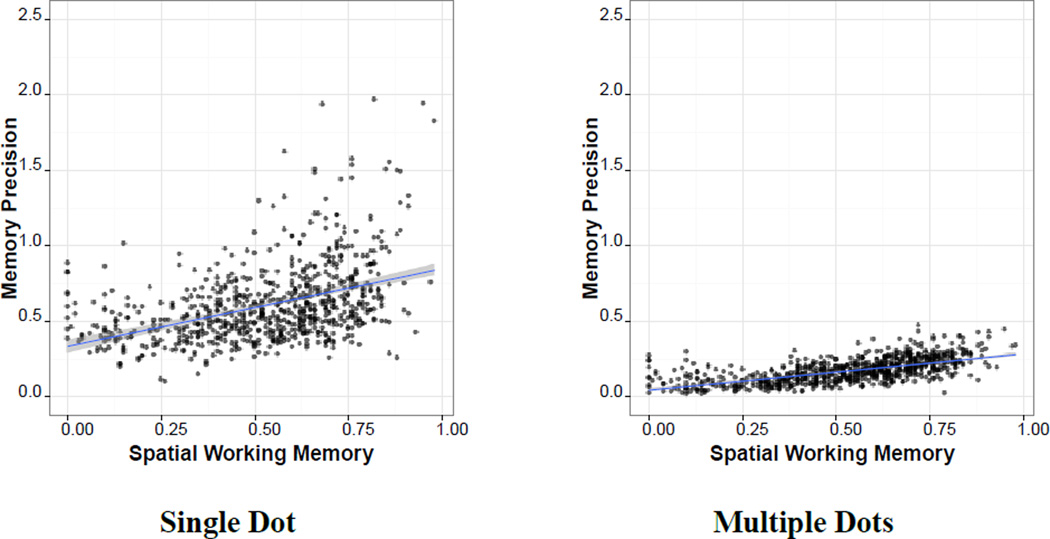
The results in Table 3 show that memory precision is significantly predicted by scores on a spatial working memory task in both the single-dot (.35) and multiple dot (.39) tasks, as shown in Figure 8. The finding is especially interesting in the single dot task because a single location is well within the capacity of most people. With precision on the single dot task accounted for, SWM accounts for additional variance in the multiple dot task, which more closely resembles tasks used to assess SWM capacity. In addition, although prior work suggested that age would have little relationship to memory precision when only one location was to be remembered, here we find a small but significant effect of age for that task (−.12).
Figure 8.
Working memory and estimated precision.
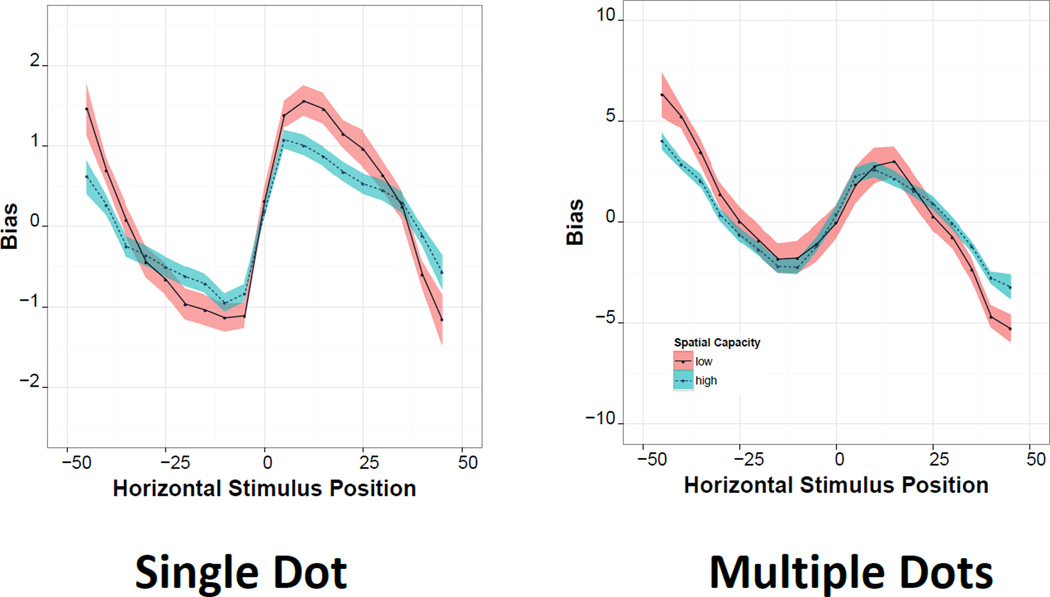
We predicted that those with lesser spatial working memory capacity would show greater reliance on spatial categories when estimating locations. This effect emerges with small but significant correlations between spatial working memory capacity and category weight in both the single dot (.24) and multiple dot tasks (.32; see Figure 9). Once spatial working memory is taken into account, age and verbal working memory did not significantly predict further variance in most cases, suggesting that this finding may be specific to spatial working memory. However, the correlation between spatial and verbal working memory capacity was .53 and both correlated with age (−.35 and −.26, respectively), making it difficult to make definitive conclusions about specificity of mechanism.
Figure 9.
Overall bias patterns for single-dot and multiple-dot tasks, separated by those scoring higher versus lower than the group average on the SWM capacity.
Results for the fixed outward bias factor were smaller and less consistent. In the single dot task, there was a small but significant effect of age (.11), suggesting that increased age was associated with a smaller tendency to shift estimates outward. In the multiple dot task, those with higher spatial working memory capacity tended to show decreased fixed outward bias (−.31). The pattern could suggest that, like category-based adjustment, fixed outward bias is something people engage in more when memory capacity is limited, however, the inclusion of a fixed outward bias parameter is novel, and caution is recommended in interpreting individual-difference patterns at this point.
Here we have assumed that precision is the common factor between the location memory task and the running span measure of spatial working memory capacity, and that the lack of precision gives rise to bias in location memory. However another possibility is that it is the bias that we observe in location memory also influences performance on the running span task. This seems unlikely because the tasks use very different kinds of displays and responses: In the location memory tasks, a response dot can be placed anywhere on the screen, and the only visibly present structure is the edge of the screen. In the running span task (Figure 3), the screen shows a grid with 12 bounded response boxes and participants are asked to indicate in which box a dot had appeared, not to remember the location of the dot within the box. However, it is possible that there are systematic biases in the running span task that are ignored by scoring the task in terms of overall accuracy, and it is possible that those who show outward bias on one will tend to show outward on the other. To assess this, we analyzed the kinds of errors made to the four central squares in the running task. For each instance in which a square was selected that was adjacent to the correct square, we coded it as either a horizontal outward error, a horizontal inward error, a vertical outward error, or a vertical inward error. For example, for the stimulus location shown in Figure 3, a response in the box above it was coded as a vertical outward error, a response in the box below it was coded as a vertical inward error, a response in the box left of it was coded as a horizontal outward error, and a response in the box to the right of it was coded as a horizontal inward error. Overall, we found no outward or inward bias in responses. The number of outward horizontal errors per participant, M = 1.04, 95% CI [0.96, 1.11], was comparable to the number of inward ones, M =1.01, 95% CI [.93, 1.09], and the number of outward vertical errors, M =1.42, 95% CI [1.33, 1.51], per participant was comparable to the number of inward ones, M =1.44, 95% CI [1.35, 1.53]. In addition, the degree of outward bias for each participant on the running span task did not correlate significantly with model parameters from the location memory task (all correlation coefficients between −.05 and .08). Thus there is no evidence that the correlations we observe between SWMC performance and location memory performance are due to a common underlying bias in spatial memory.
Discussion
Previous studies that have examined how age or cognitive constructs relate to spatial memory have usually examined error in responses, calculated as the distance from stimulus to response (e.g., Lavenex et al., 2015; Olson et al., 2004; Siedlecki & Salthouse, 2014). The present study takes a different approach in that it conceptualizes responses as the product of an assembly of information sources, including a noisy memory trace, a spatial organization, and an additional fixed bias. Here we model those components and examine how individuals differ with respect to these parameters and what factors may predict those differences. We find that spatial working memory capacity predicts category bias and precision: those with higher spatial working memory scores tended to have less category bias and greater precision in spatial memory. Verbal WMC was a much weaker predictor, suggesting that these findings do not reflect a domain general ability to deploy and maintain attention but instead are relatively specific to spatial information.
The finding that SWMC predicts bias in location memory is predicted by a combination of models that treat SWMC as an allocatable resource with the category adjustment model of spatial memory. According to the optimal Bayesian weighting embedded in CAM, categories are weighted more heavily, and thus estimates are more biased, when memory is less precise. As noted in the introduction, a relation between precision and storage capacity is predicted by many models of SWMC, such as resource models (e.g., Bays & Hussain, 2008; Bays et al., 2011; Fougnie et al., 2010), updated slot models (Zhang & Luck, 2008), the map-architecture account from Franconeri and colleagues (e.g., Franconeri et al., 2013) and a recent model from Lavenex and colleagues (Lavenex et al., 2015). The literatures on spatial working memory capacity limits and on bias in location memory have been largely separate even though both invoke the same theoretical construct of memory precision, and the connection between these invocations of precision has been unexamined. Integrating these literatures generated a novel prediction that bias patterns in location memory would be related to capacity limits. The verification of this prediction confirms that these literatures are addressing related notions of precision and suggests the possibility of integrated models that combine capacity limits and rational Bayesian adjustment strategies.
The results presented here validate the core assumption of the Category Adjustment Model that category use is proportional to memory precision and establish this effect at the level of individual participants. This is shown by the good fits obtained by including individual-level parameters for category use and memory trace precision in the model, by the correlations between those parameters among spatial dimensions and across different versions of the task, and by the finding that the values on these parameters are predicted by measures of an individual’s spatial working memory capacity. The relation between category use and precision also emerges in group-level data by the finding that category use is greater and precision less in the three-dot version than in the single-dot version of the task, and by the finding that within the three-dot version, category use is greater for dots held in memory longer.
However the results also show that there is another source of bias in estimates that is not anticipated by the Category Adjustment Model. We accounted for this by including a fixed outward bias factor to capture the tendency to systematically shift estimates inward or, more commonly, outward. Visual examination of the data reported by earlier studies on spatial memory biases suggests a general tendency for outward bias (Huttenlocher et al., 1994; Crawford & Duffy, 2010), but in most cases has not been explicitly addressed (but see Barth et al., 2014). To our knowledge there is not a compelling theoretical explanation for why estimates would be biased further away from an invisible, subjectively imposed internal boundary than from the actually visible edges of the spatial frame. This outward bias is reminiscent of caricature effects in the categorization literature (Goldstone, 1996), which would suggest that spatial memory may be affected by idealized extremes of left and right, top and bottom (c.f., Crawford, Landy, & Presson, 2014). Our finding that fixed outward bias is related to working memory capacity in challenging versions of the dot location task, and that it is correlated with category weight, may help to provide a starting point for investigating this bias. Also, we note that the same basic pattern of outward bias emerges in other tasks that rely on spatial placement of responses, such as placing numbers along a number line (Landy, Charlesworth, & Ottmar, 2014). To the extent that space is used to represent other concepts, such as number and quantity, we might expect performance on those tasks to be predicted by the same individual differences that predict bias in spatial memory.
Investigations of individual differences can serve as a useful complement to the experimental research on spatial memory biases. Rather than taking the variability between individuals and throwing it into the error term (Eysenck, 1997), we can use it test predictions generated from cognitive theories. As we seek to understand the component processes that give rise to spatial memory bias and other memory phenomena, the natural variation between people can steer the development of theory and ensure that the conclusions we draw about cognition on the whole also apply to individual minds.
Acknowledgments
Support for this work came from National Institute on Aging Grant R37AG024270 to TAS.
Appendix
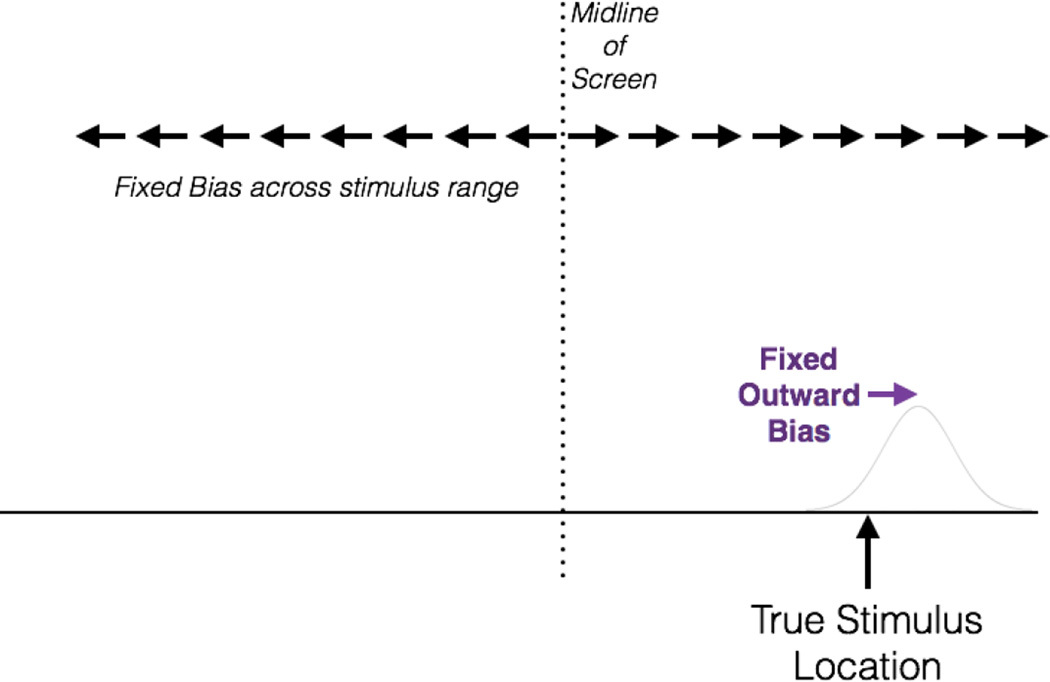
We modeled participant behavior as the interaction of three parameters: memory precision (τ), category precision, (c), fixed outward bias, (f). The first thing that happens, after a stimulus is presented and observed, is that a memory for the stimulus item is constructed. This memory is imperfectly precise, and we capture it as a truncated normal distribution with variance 1/τ, and truncation at the screen boundary. We assume that fixed outward biasing happens very early in processing (Crawford et al., 2014), so that the mean of the memory distribution for a stimulus located at position x is sx (see Figure A1). However, fixed bias and truncation were independent.
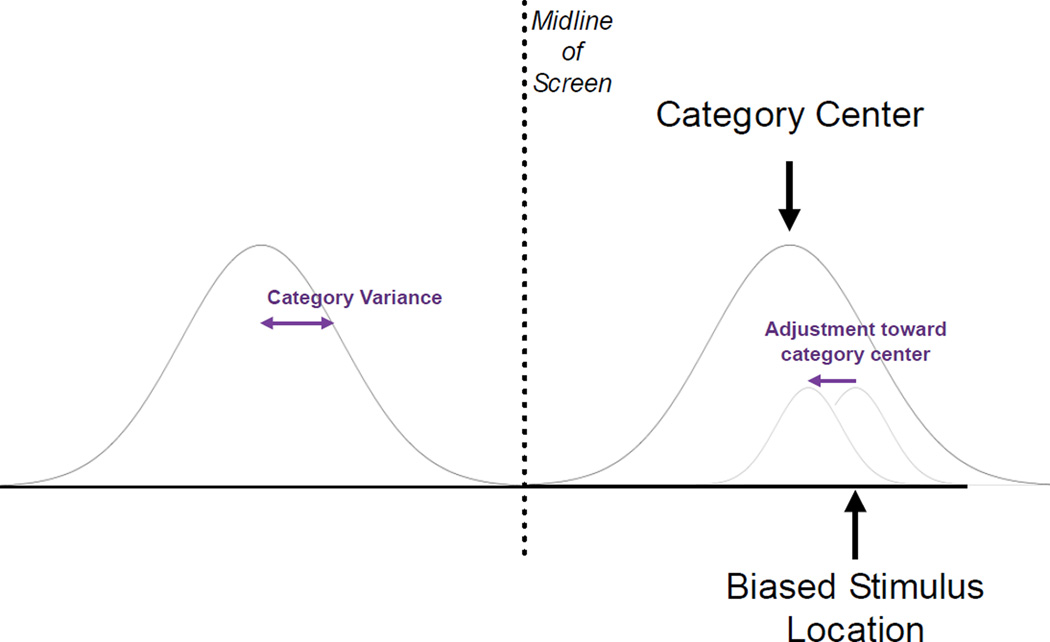
We assumed that people treated stimuli as being generated by two normally distributed categories: one on each side of the (unidimensional) space (see Figure A2). These categories had variance 1/c. These left and right side categories were centered at the midpoints of each side (we call this position h, for halfway), and had a fitted precision which varied across participants, tasks, and dimensions. The more precise the category, the more informative, and the more Bayesian reasoning mandates using the categories. How people construct categories to reflect spatial distributions is a topic of general interest, but was not central to the investigation here. Worth noting, however, is that the actual stimuli were uniformly presented withing the interior 85% of the screen, not by normally distributed categories.
When both category and memory representation are normal, the theoretically optimal balance of categorical and instance information is given by the normal-normal model (Huttenlocher, Hedges, and Vevea, 2000). The result is a normal distribution with mean
Where b is the category bias, given by
and the fraction serves to set the sign of the fixed bias, f.
The precision of the resulting normal is given by
We assumed that people sampled form this normal distribution to general the given responses. Of course, this assumes people know which category the item belong in, which near the center of the category is not given. The model considered the probability of correct classification to be equal to the proportion of the memory distribution which was on the correct side of the screen middle. Because the model is generative, this means that the prediction is is that some proportion of the time, the model biases leftward, and the remaining time rightward; The proportion is given by the relative densities of the category distributions, which near the midline is not close to 0 or 1. When an item is miscategorized, it biases toward the far category. Thus, items in the middle are expected to show less mean bias than items closer to category centers.
Close examination of the residuals reveals some remaining systematic structure near the midline, and near the edges of the screen. This residual structure suggests that the current model is imperfectly capturing behavior, though it dramatically improves over the pure outward bias or pure CAM models. As mentioned in the main text, we regarded the model fits to be adequate at this point, though certainly there is more left to do.
Figure A1.
Effect of outward bias on memory trace. Outward bias systematically moves the mean of the trace distribution outward by a fixed amount. It does not alter the shape of the distribution.
Figure A2.
Summary of the category adjustment component of the model. Responses are adjusted away from the (already biased by fixed outward bias) stimulus location, in the direction of the nearest category, through a weighted average of the mean of the two distributions. Category weighting is increased by precise categories, and decreased by precise spatial memory traces. Near the midline of the screen, the stimulus is adjusted toward both categories, weighted by the proportion of the memory trace that is best-fitted by each category.
Footnotes
We note that some psychophysical models based on Stevens’s power law have also proposed to account for biases in spatial estimation (e.g., Barth, Lesser, Taggart, & Slusser, 2014; Hollands & Dyre, 2000), but they do not account for the effect of longer delays on bias.
We initially also looked at gender because Holden, Duff-Canning, & Hampson. (2014) reported that women may show stronger category biases than men. However we found that gender accounted for negligible additional variance beyond age and the two working memory measures, so we dropped it from the analyses.
Contributor Information
L. Elizabeth Crawford, Department of Psychology, University of Richmond.
David H. Landy, Department of Psychological & Brain Sciences, Indiana University
Timothy A. Salthouse, Department of Psychology, University of Virginia
References
- Baloff N, Becker SW. On the futility of aggregating individual learning curves. Psychological Reports. 1967;20(1):183–191. doi: 10.2466/pr0.1967.20.1.183. [DOI] [PubMed] [Google Scholar]
- Barth H, Lesser E, Taggart J, Slusser E. Spatial estimation: A non-Bayesian alternative. Developmental Science. 2014 doi: 10.1111/desc.12264. [DOI] [PubMed] [Google Scholar]
- Bays PM, Husain M. Dynamic shifts of limited working memory resources in human vision. Science. 2008;321:851–854. doi: 10.1126/science.1158023. [DOI] [PMC free article] [PubMed] [Google Scholar]
- Bays PM, Wu EY, Husain M. Storage and binding of object features in visual working memory. Neuropsychologia. 2011;49:1622–1631. doi: 10.1016/j.neuropsychologia.2010.12.023. [DOI] [PMC free article] [PubMed] [Google Scholar]
- Bleckley MK, Durso FT, Crutchfield JM, Engle RW, Khanna MM. Individual differences in working memory capacity predict visual attention allocation. Psychonomic Bulletin & Review. 2003;10:884–889. doi: 10.3758/bf03196548. [DOI] [PubMed] [Google Scholar]
- Cowan N. The magical number 4 in short-term memory: A reconsideration of mental storage capacity. Behavioral and Brain Sciences. 2001;24:87–185. doi: 10.1017/s0140525x01003922. [DOI] [PubMed] [Google Scholar]
- Crawford LE, Duffy SE. Sequence effects in estimating spatial location. Psychonomic Bulletin & Review. 2010;17:725–730. doi: 10.3758/PBR.17.5.725. [DOI] [PubMed] [Google Scholar]
- Crawford LE, Landy DH, Presson AN. Proceedings of the 36th Annual Conference of the Cognitive Science Society. Quebec City, Quebec: Cognitive Science Society; 2014. Bias in spatial memory: Prototypes or relational categories. [Google Scholar]
- Crawford LE, Jones E. The flexible use of inductive and geometric spatial categories. Memory & Cognition. 2011;39:1055–1067. doi: 10.3758/s13421-011-0089-9. [DOI] [PubMed] [Google Scholar]
- Engebretson PH, Huttenlocher J. Bias in spatial location due to categorization: Comment on Tversky and Schiano. Journal of Experimental Psychology: General. 1996;125:96–108. doi: 10.1037//0096-3445.125.1.96. [DOI] [PubMed] [Google Scholar]
- Eysenck HJ. Personality and experimental Psychology: The unification of Psychology and the possibility of a paradigm. Journal of Experimental Psychology. 1997;73:1224–1237. [Google Scholar]
- Fougnie D, Asplund CL, Marois R. What are the units of storage in visual working memory? Journal of Vision. 2010;10:1–11. doi: 10.1167/10.12.27. [DOI] [PMC free article] [PubMed] [Google Scholar]
- Franconeri SL, Alvarez GA, Cavanagh P. Flexible cognitive resources: Competitive content maps for attention and memory. Trends in Cognitive Sciences. 2013;17:134–141. doi: 10.1016/j.tics.2013.01.010. [DOI] [PMC free article] [PubMed] [Google Scholar]
- Freyd JJ, Johnson JQ. Probing the time course of representational momentum. Journal of Experimental Psychology: Learning, Memory, and Cognition. 1987;13:259–268. doi: 10.1037//0278-7393.13.2.259. http://dx.doi.org/10.1037/0278-7393.13.2.259. [DOI] [PubMed] [Google Scholar]
- Gelman A, Carlin JB, Stern HS, Rubin DB. Bayesian data analysis (Vol. 2) Chapman & Hall/CRC; 2014. [Google Scholar]
- Goldstone RL. Isolated and interrelated concepts. Memory & Cognition. 1996;24:608–628. doi: 10.3758/bf03201087. [DOI] [PubMed] [Google Scholar]
- Holden MP, Duff-Canning SJ, Hampson E. Sex differences in the weighting of metric and categorical information in spatial location memory. Psychological Research. 2014:1–18. doi: 10.1007/s00426-013-0539-z. [DOI] [PubMed] [Google Scholar]
- Hollands JG, Dyre BP. Bias in proportion judgments: the cyclical power model. Psychological Review. 2000;107:500–524. doi: 10.1037/0033-295x.107.3.500. [DOI] [PubMed] [Google Scholar]
- Hund AM, Spencer JP. Developmental changes in the relative weighting of geometric and experience-dependent location cues. Journal of Cognition and Development. 2003;4:3–38. [Google Scholar]
- Huttenlocher J, Hedges LV, Corrigan B, Crawford LE. Spatial categories and the estimation of location. Cognition. 2004;93:75–97. doi: 10.1016/j.cognition.2003.10.006. [DOI] [PubMed] [Google Scholar]
- Huttenlocher J, Hedges LV, Duncan S. Categories and particulars: Prototype effects in estimating spatial location. Psychological Review. 1991;98:352–376. doi: 10.1037/0033-295x.98.3.352. [DOI] [PubMed] [Google Scholar]
- Huttenlocher J, Newcombe N, Sandberg EH. The coding of spatial location in young children. Cognitive Psychology. 1994;27:115–147. doi: 10.1006/cogp.1994.1014. [DOI] [PubMed] [Google Scholar]
- Johnson JS, Simmering VR, Buss AT. Beyond slots and resources: Grounding cognitive concepts in neural dynamics. Attention, Perception, & Psychophysics. 2014;76:1630–1654. doi: 10.3758/s13414-013-0596-9. [DOI] [PMC free article] [PubMed] [Google Scholar]
- Kane MJ, Poole BJ, Tuholski SW, Engle RW. Working memory capacity and the top-down control of visual search: Exploring the boundaries of "executive attention". Journal of Experimental Psychology: Learning, Memory, and Cognition. 2006;32:749–777. doi: 10.1037/0278-7393.32.4.749. [DOI] [PubMed] [Google Scholar]
- Landy D, Charlesworth A, Ottmar E. Proceedings of the 36th Annual Conference of the Cognitive Science Society. Quebec City, Quebec: Cognitive Science Society; 2014. Cutting in line: discontinuities in the use of large numbers in adults. [Google Scholar]
- Lavenex PB, Boujon V, Ndarugendamwo A, Lavenex P. Human short-term spatial memory: Precision predicts capacity. Cognitive Psychology. 2015;77:1–19. doi: 10.1016/j.cogpsych.2015.02.001. [DOI] [PubMed] [Google Scholar]
- Luck SJ, Vogel EK. The capacity of visual working memory for features and conjunctions. Nature. 1997;390:279–281. doi: 10.1038/36846. [DOI] [PubMed] [Google Scholar]
- Noack H, Lövdén M, Lindenberger U. Normal aging increases discriminal dispersion in visuospatial short-term memory. Psychology and Aging. 2012;27:627–637. doi: 10.1037/a0027251. [DOI] [PubMed] [Google Scholar]
- Olson IR, Zhang JX, Mitchell KJ, Johnson MK, Bloise SM, Higgins JA. Preserved spatial memory over brief intervals in older adults. Psychology and Aging. 2004;19:310. doi: 10.1037/0882-7974.19.2.310. [DOI] [PubMed] [Google Scholar]
- Peich MC, Husain M, Bays PM. Age-related decline of precision and binding in visual working memory. Psychology & Aging. 2013;28:729–743. doi: 10.1037/a0033236. [DOI] [PMC free article] [PubMed] [Google Scholar]
- Salthouse TA. What cognitive abilities are involved in trail-making performance? Intelligence. 2011;39:222–232. doi: 10.1016/j.intell.2011.03.001. [DOI] [PMC free article] [PubMed] [Google Scholar]
- Salthouse TA, Pink JE, Tucker-Drobe EM. Contextual analysis of fluid intelligence. Intelligence. 2008;36:464–484. doi: 10.1016/j.intell.2007.10.003. [DOI] [PMC free article] [PubMed] [Google Scholar]
- Schurgin MW, Flombaum JI. How undistorted memories can produce distorted responses. Attention, Perception, & Psychophysics. 2014;76:1371–1380. doi: 10.3758/s13414-014-0647-x. [DOI] [PubMed] [Google Scholar]
- Siedlecki KL, Salthouse TA. Using contextual analysis to investigate the nature of spatial memory. Psychonomic Bulletin & Review. 2014;21:721–727. doi: 10.3758/s13423-013-0523-z. [DOI] [PMC free article] [PubMed] [Google Scholar]
- Simmering VR, Perone S. Working memory capacity as a dynamic process. Frontiers in Psychology. 2013;3:567. doi: 10.3389/fpsyg.2012.00567. [DOI] [PMC free article] [PubMed] [Google Scholar]
- Simmering VR, Spencer JP. Carving up space at imaginary joints: Can people mentally impose arbitrary spatial category boundaries? Journal of Experimental Psychology: Human Perception and Performance. 2007;33(4):871–894. doi: 10.1037/0096-1523.33.4.871. [DOI] [PubMed] [Google Scholar]
- Simmering VR, Spencer JP, Schöner G. Reference-related inhibition produces enhanced position discrimination and fast repulsion near axes of symmetry. Perception and Psychophysics. 2006;68:1027–1046. doi: 10.3758/bf03193363. [DOI] [PubMed] [Google Scholar]
- Spencer JP, Hund AM. Prototypes and particulars: Geometric and experience dependent spatial categories. Journal of Experimental Psychology: General. 2002;131:16–37. doi: 10.1037//0096-3445.131.1.16. [DOI] [PubMed] [Google Scholar]
- Spencer JP, Perone S, Johnson JS. The dynamic field theory and embodied cognitive dynamics. In: Spencer JP, Thomas MS, McClelland JL, editors. Toward a Unified Theory of Development: Connectionism and Dynamic Systems Theory Re-Considered. New York: Oxford University Press; 2009. [Google Scholar]
- Unsworth N, Engle RW. The nature of individual differences in working memory capacity: Active maintenance in primary memory and controlled search from secondary memory. Psychological Review. 2007;114:104–132. doi: 10.1037/0033-295X.114.1.104. [DOI] [PubMed] [Google Scholar]
- Welford AT. Between bodily changes and performance: Some possible reasons for slowing with age. Experimental Aging Research. 1984;10:73–88. doi: 10.1080/03610738408258548. [DOI] [PubMed] [Google Scholar]
- Zhang W, Luck SJ. Discrete fixed-resolution representations in visual working memory. Nature. 2008;453:233–235. doi: 10.1038/nature06860. [DOI] [PMC free article] [PubMed] [Google Scholar]


