Fig. 1.

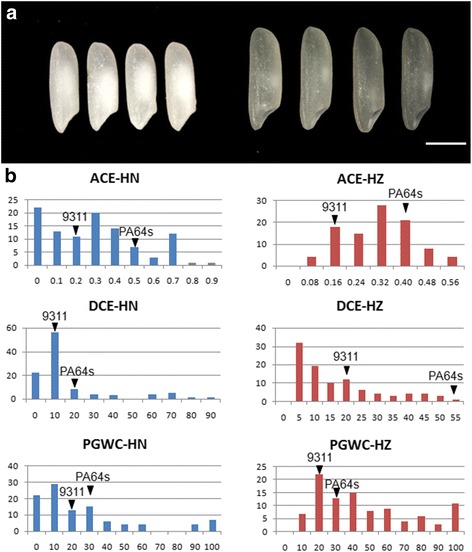
Comparison of chalkiness between two parents and distribution of ACE, DCE and PGWC in the RIL population. a Seeds of PA64s (left) and 9311 (right). Bar =2.5 mm. b HN represents Hainan and HZ represents Hangzhou

Comparison of chalkiness between two parents and distribution of ACE, DCE and PGWC in the RIL population. a Seeds of PA64s (left) and 9311 (right). Bar =2.5 mm. b HN represents Hainan and HZ represents Hangzhou