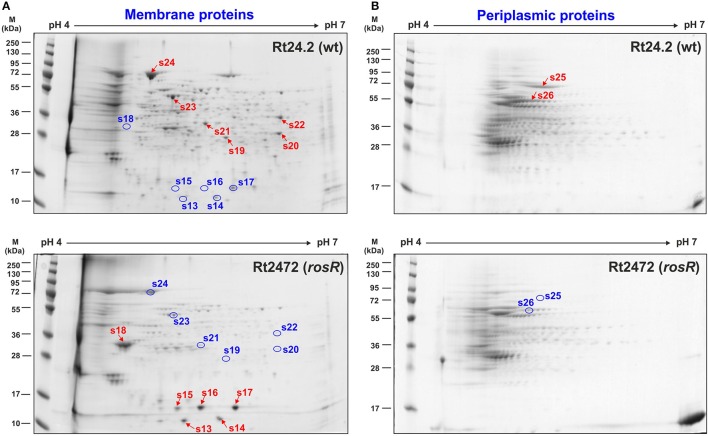
Figure 3.
Two-dimensional electrophoretic profiles of membrane (A) and periplasmic proteins (B) of Rt24.2 and Rt2472. Individual protein fractions (100 μg) were analyzed (molecular weight marker, prestained protein ladder, 10–250 kDa, Thermo Scientific). Spots containing proteins in higher amounts which were excised from the gel are marked by red arrows, whereas those containing diminished protein amounts were marked by blue circles.

