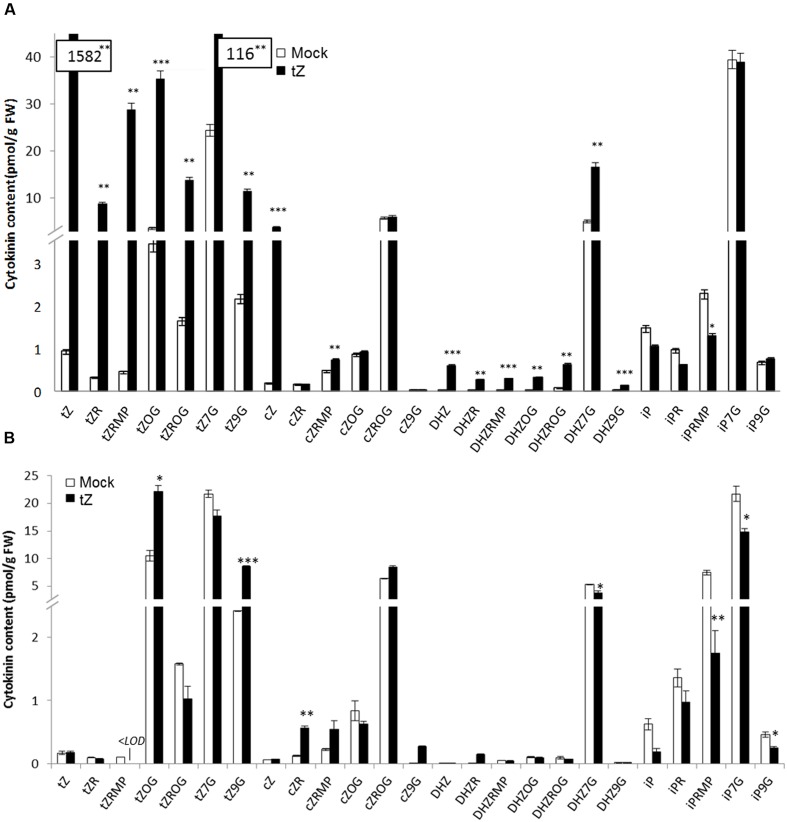
FIGURE 3.
Cytokinin content in whole plants of WT A. thaliana after tZ treatment (A) and in detached leaves after KIN treatment (B). Values are the means of three biological replicates with ± error bars that represent standard deviations. Asterisks over bars indicate significant differences between KIN treated and mock control plants according to two-tailed unpaired Student’s t-test, ∗P < 0.05, ∗∗P < 0.01, ∗∗∗P < 0.001.

