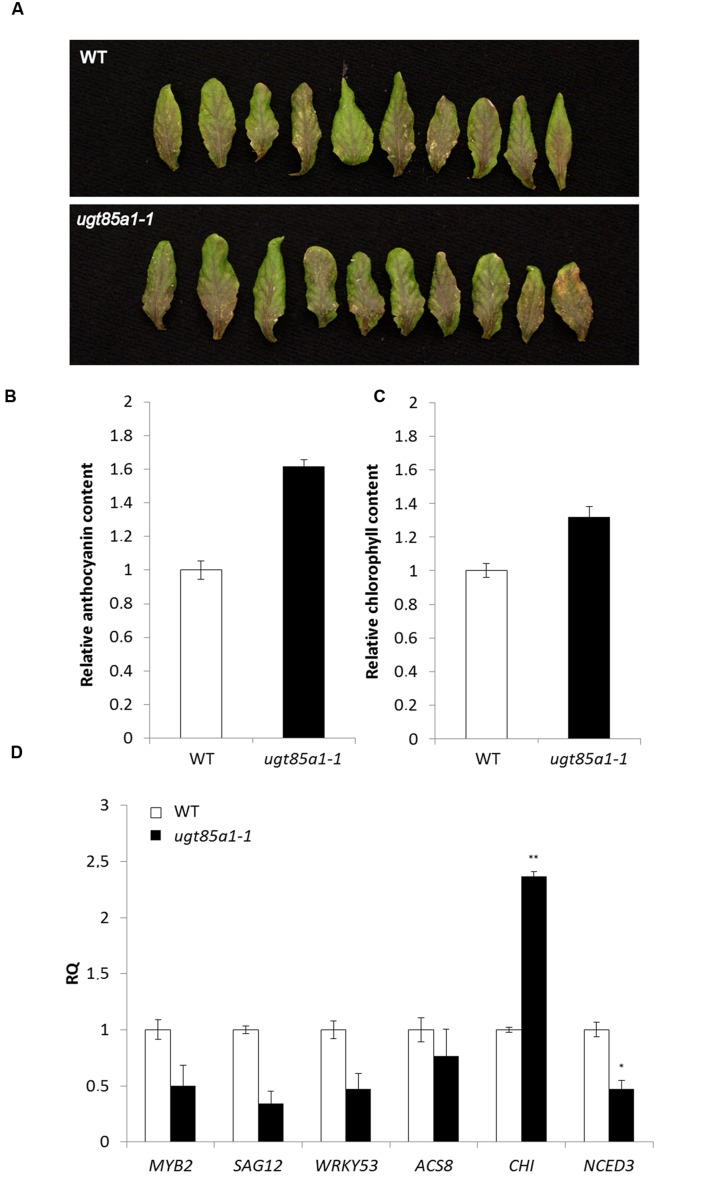
FIGURE 4.
Characterization of ugt85a1-1 mutant. Detached leaves of WT and the mutant after 3 days of continuous light (A), chlorophyll content (B), anthocyanin content (C) and gene expression profile of senescence and stress related markers (D) including anthocyanin biosynthetic gene CHI. Values are the means of two independent experiments where leaves of ten individual plants were pooled and expressed as relative quantities extrapolated to WT control (white) that is given as 1.0 with error bars representing standard deviations. Asterisks indicate significant difference between WT and transgenic tissue according to two-tailed unpaired Student’s t-test, ∗P < 0.05, ∗∗P < 0.01.

