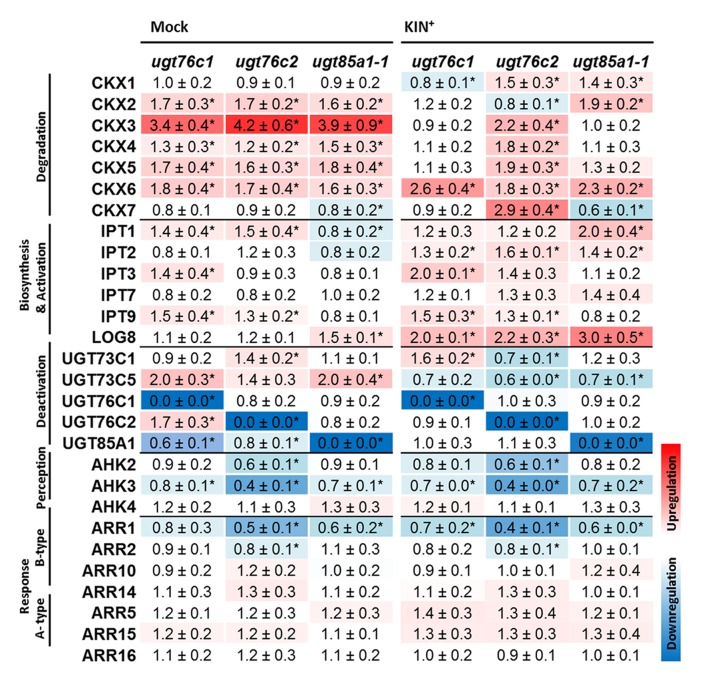
FIGURE 8.
Expression profiles of cytokinin metabolism, perception and response genes under standard conditions (Mock treatment) and after kinetin treatment (KIN+) in detached leaves of A. thaliana ugt76c1, ugt76c2 or ugt85a1-1 mutants. The gene expressions of the mutant plants are expressed as relative quantities and extrapolated relative to the mock treatment and KIN treated WT, respectively, given as 1.0. The values represent means of three biological replicates (three technical replicates) with standard deviations. Asterisks indicate significant differences between controls and samples according to two-tailed unpaired Student’s t-test, ∗P < 0.05; < LOD, below limit of detection. No expression was detected for LOG2, LOG6 and LOG7.

