
. 2016 Aug 23;7:1245. doi: 10.3389/fpsyg.2016.01245
Copyright © 2016 Obeid, Brooks, Powers, Gillespie-Lynch and Lum.
This is an open-access article distributed under the terms of the Creative Commons Attribution License (CC BY). The use, distribution or reproduction in other forums is permitted, provided the original author(s) or licensor are credited and that the original publication in this journal is cited, in accordance with accepted academic practice. No use, distribution or reproduction is permitted which does not comply with these terms.
FIGURE 4.
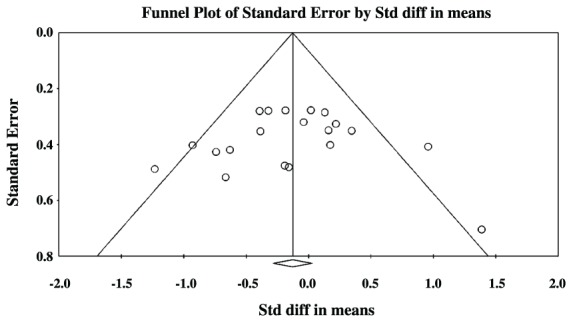
Funnel plot of SMD plotted against standard errors for the ASD comparisons.