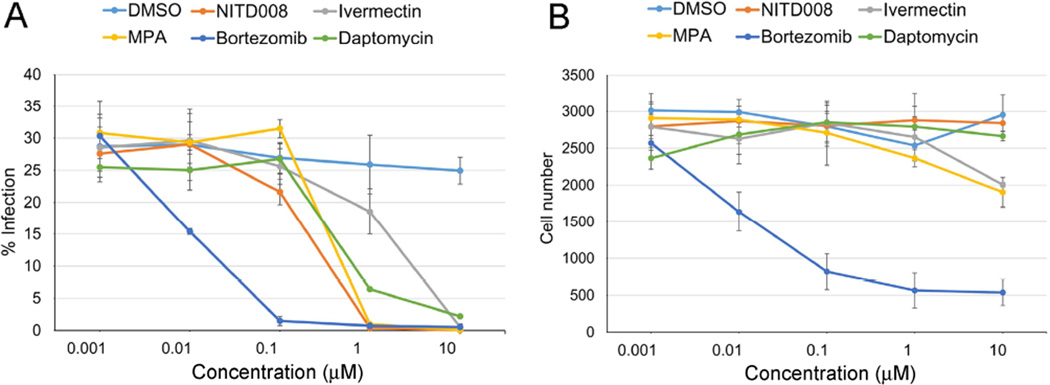
Figure 2. Validation of selected drugs in ZIKV-infected HuH-7 cells.
(A) Infection rates as a function of drug concentration are shown. (B) Cell numbers for the indicated drug treatments are shown. Data for all 30 drugs tested in follow up experiments are in Figure S2. Data are represented as mean +/− standard deviation.

