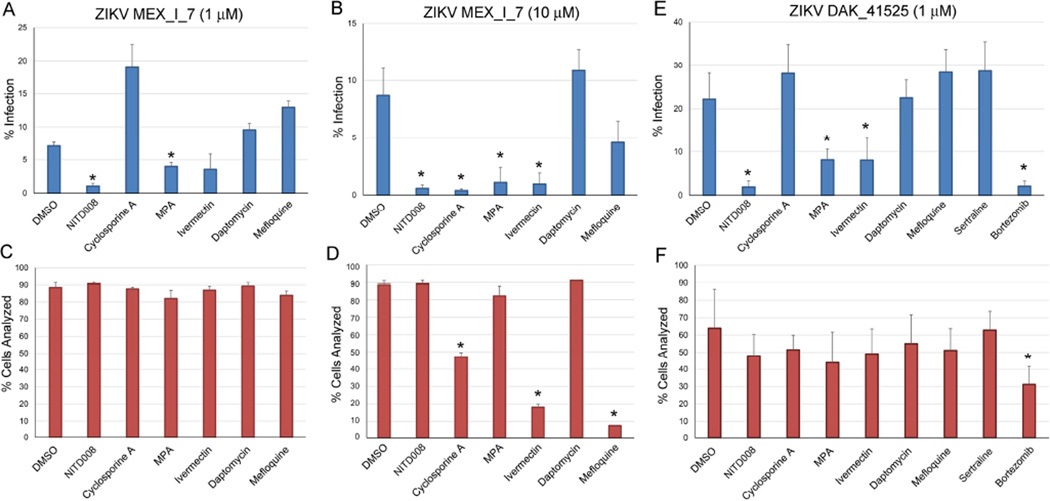
Figure 4. Effects of selected drug on infection of human neural stem cells (hNSC).
Rates of hNSC infection by ZIKV MEX_I_7 are shown for treatment conditions of 1 µM (A) and 10 µM (B). The % of cells that were analyzed for virus infection is shown for 1 µM (C) and 10 µM (D) conditions for ZIKV MEX_I_7. (E) Infection by ZIKV DAK_41525 under conditions of 1 µM drug treatment. Data are represented as mean +/− standard deviation (F) The % of cells that were analyzed for ZIKV DAK_41525. See Figure S4 for light scattering and fluorescence intensity data associated with the ZIKV MEX_I_7 infection. Asterisks indicate statistically significant reductions of virus infection or cells analyzed at a P value of <0.05 as calculated by unpaired t-test.

