
Figure 3.
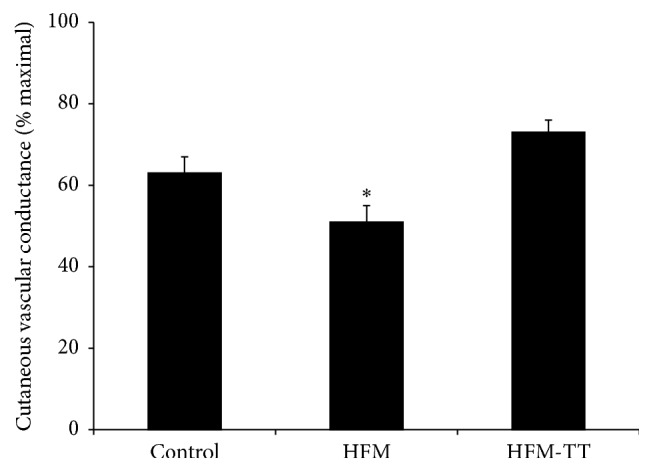
Plateau %CVCmax. Plateau %CVCmax for the control, high fat meal (HFM), and high fat meal plus TT (HFM-TT) trials. Plateau in the HFM trial was attenuated compared to both the control and HFM-TT trials. There was no difference between the control and HFM-TT trials. ∗ P < 0.05 versus control and HFM-TT trials. Data are group mean ± SEM.