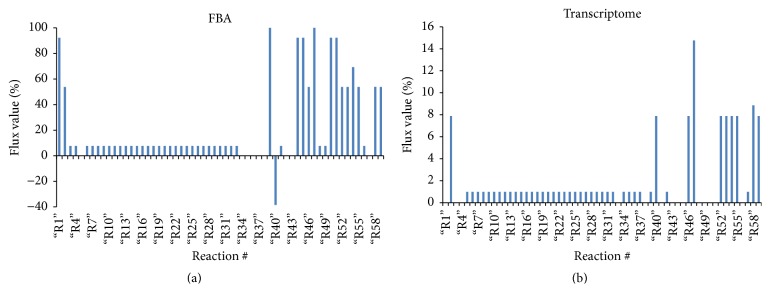
Figure 3.
Flux graph generated using the software MATLAB, which uses methods based on FBA constraints. The vertical axis represents the fluxes calculated from the input of 100 moles of acetyl-CoA (AcCoA). The horizontal axis represents the reactions participating in the fatty acid biosynthesis pathway. The blue bars determine the output percentage for each pathway reaction. (a) FBA for maximizing the production of hexadecenoic acid. (b) FBA calculated with the log2FC values obtained from the transcriptome.

