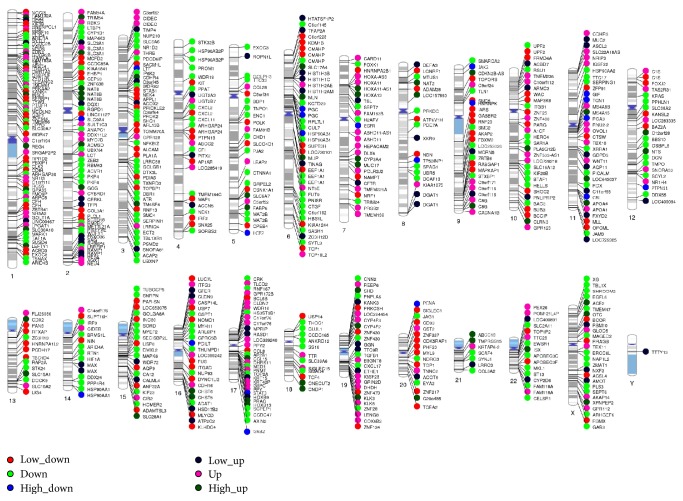
Figure 8.
Whole-chromosome bird-view of expression levels of the 400 top DEGs located to 23 chromosomes. The color of each circle stands for the relative level of one DEG. Expression levels are normalized to six grades (low-up/4–6-fold, up/7–10-fold, and high up/more than 10-fold; low-down/4–6-fold, down/7–10-fold, and high down/more than 10-fold).

