. 2016 Aug 9;2016:3016245. doi: 10.1155/2016/3016245
Copyright © 2016 P. Unnikrishnan et al.
This is an open access article distributed under the Creative Commons Attribution License, which permits unrestricted use, distribution, and reproduction in any medium, provided the original work is properly cited.
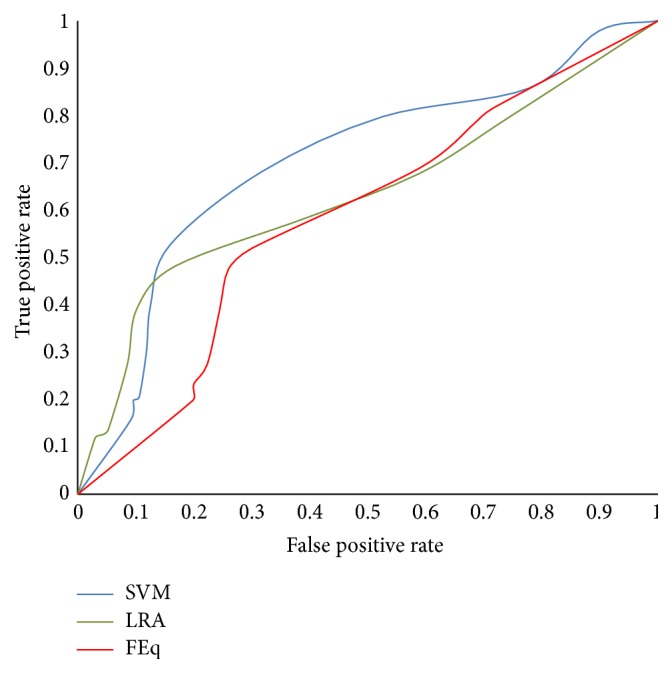
Figure 1.

ROC graph for SVM, LRA, and FEq.
