
Figure 3.
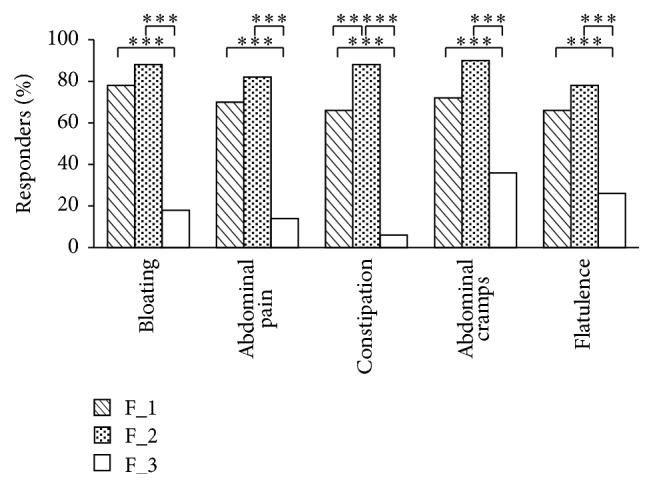
Percentage of responders to IBS-C related symptom during the treatment period (t60, days) with probiotic formulations F_1 and F_2. The Responders was defined as the subject reporting a decrease of symptoms of at least 30% compared to the basal condition for at least 50% of the intervention time. Bloating, abdominal pain, constipation, abdominal cramps, and flatulence symptoms were assessed on a numbering scale from 0 to 10 for each item subjects scored. Data are mean ± SE. Upon the square brackets are reported the intergroups F_1 and F_2 (versus placebo F_3) statistical analysis (∗∗∗ P < 0.001). The intergroups F_1 versus F_2 statistical analysis (∗∗ P < 0.01) is also reported.