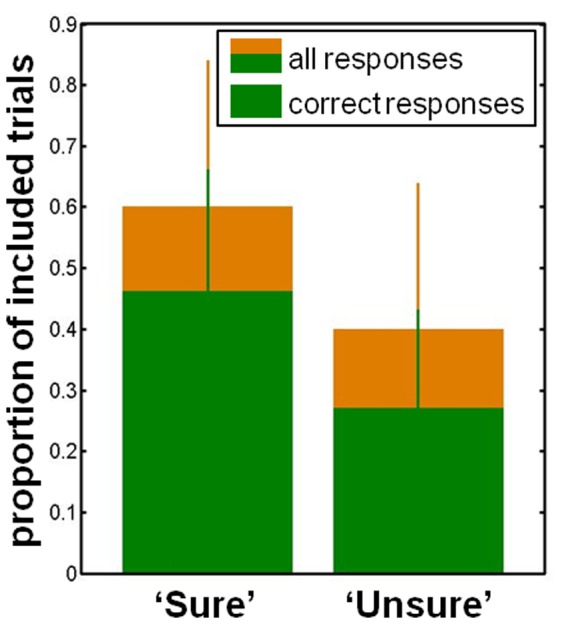
FIGURE 3.

Behavioral data. The proportion of trials in which participants were ‘sure’ as well as those in which they were ‘unsure.’ The proportion of correct responses is shown in green for each consciousness category. Median and standard deviation are displayed.
