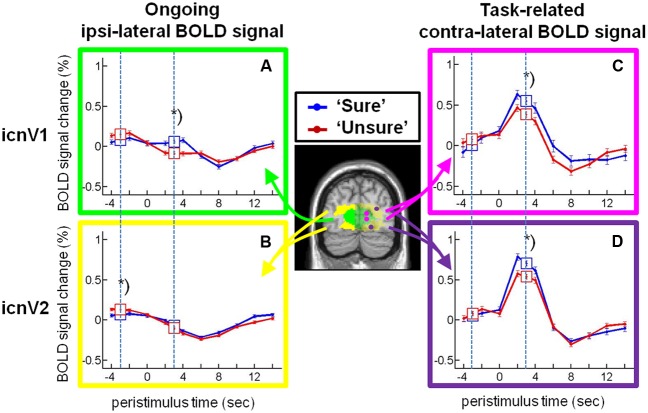
FIGURE 4.
Stimulus-locked activity in the intrinsic connectivity networks (ICNs) covering V1 and V2. Time courses (mean and standard error of the mean) of the blood oxygenation level dependent (BOLD) percent signal change for categories ‘sure’ (blue) and ‘unsure’ (red) from (A) the ipsi-lateral icnV1, (B) the ipsi-lateral icnV2, (C) the contra-lateral icnV1, and (D) the contra-lateral icnV2 are plotted. Data were corrected for the effects of temporal attention, spatial attention, and stimulated visual quadrant. The time windows for which statistical tests were performed are indicated by squares containing the respective means and standard errors of the mean and by dashed lines. The asterisks label significant differences at pc < 0.05 for ANOVA.

